Guess the TOTAL investments in online brands? There are more than 100 BRANDS. And the top HUNDRED brands have got a QUITE high branding value.
In just 2022, there has been increasing of 22% in the BRAND’s market cap despite:
- High inflation
- Increased interest rates
- Recovery from COVID-19
The current market value stands at 8.7 trillion USD.
Branding statistics highlight everything about the strong brand presence. The most valuable brand globally is AMAZON, while in the US, it is APPLE.
Interested?
Let’s learn more statistical data about the GLOBAL brands and their branding value.
Ready?
Let’s start BRANDING STATISTICS.

- Top Branding Statistics
- General Branding Statistics
- Content Branding Statistics
- Logo and Color Branding Statistics
- Social Media Branding Statistics
- Marketing Branding Statistics
- Employer Branding Statistics
- Customer Branding Statistics
- Small Business Branding Statistics
- Brand Transparency Statistics
- Brand Consistency Statistics
- Brand Personality Statistics
- B2B Branding Statistics
- B2C Branding Statistics
- Importance of First Impression on Brand
- What’s Next
Top Branding Statistics
There are SO MANY brands. In a single category, you’ve got more than 100 BRANDS. But there is one QUESTION,
Do they all succeed?
Nope. It is the BRAND consistency that supports them. Some brands leave their GOALS half on the way. Consistently presented brands have GOT some more recognition among the people.
However, there are many brands still on the TOP.
Do you know the MOST valuable brand?
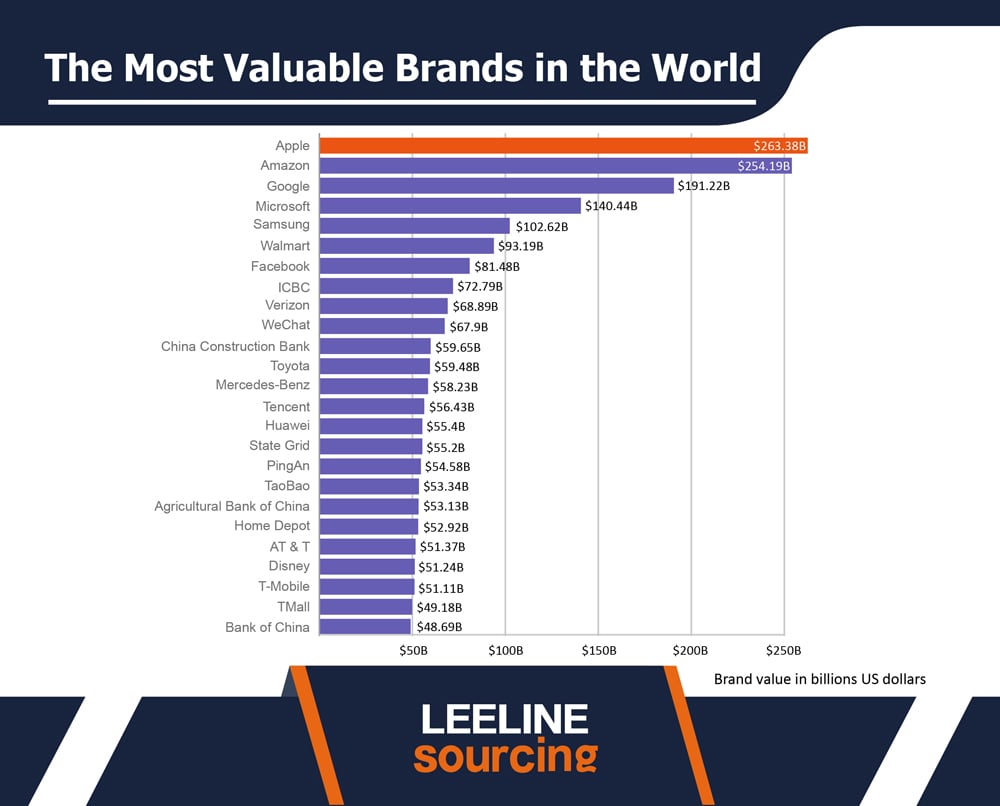
Here are the stats showing brand value for each company website.
- Apple is the NUMBER one brand in the whole globe. It has a net brand value of 263 billion. It is a mobile production company.
- Amazon is second on the LIST. The value of Amazon is 254 billion USD. It is an eCommerce site targeting the online market.
- Google has got a THIRD RANK. Its value is 191 BILLION USD. And Google is a search engine.
- Microsoft is FOURTH on the list. Its value is 140 BILLION USD. Microsoft is a Software product and computer company.
- Other popular names include Samsung, Walmart, etc.
General Branding Statistics
In BRANDING, trust is the key. Look. No one knew Amazon 20 years ago. It was just the START.
Amazon is now more popular. Do you know why? It is because :
- Trust
- Quality
- Customer service
And many more factors. Customers prefer a BRAND that provides them with the BEST service. Who listens to them?
I have got some branding statistics you should know for excellent brand visibility.
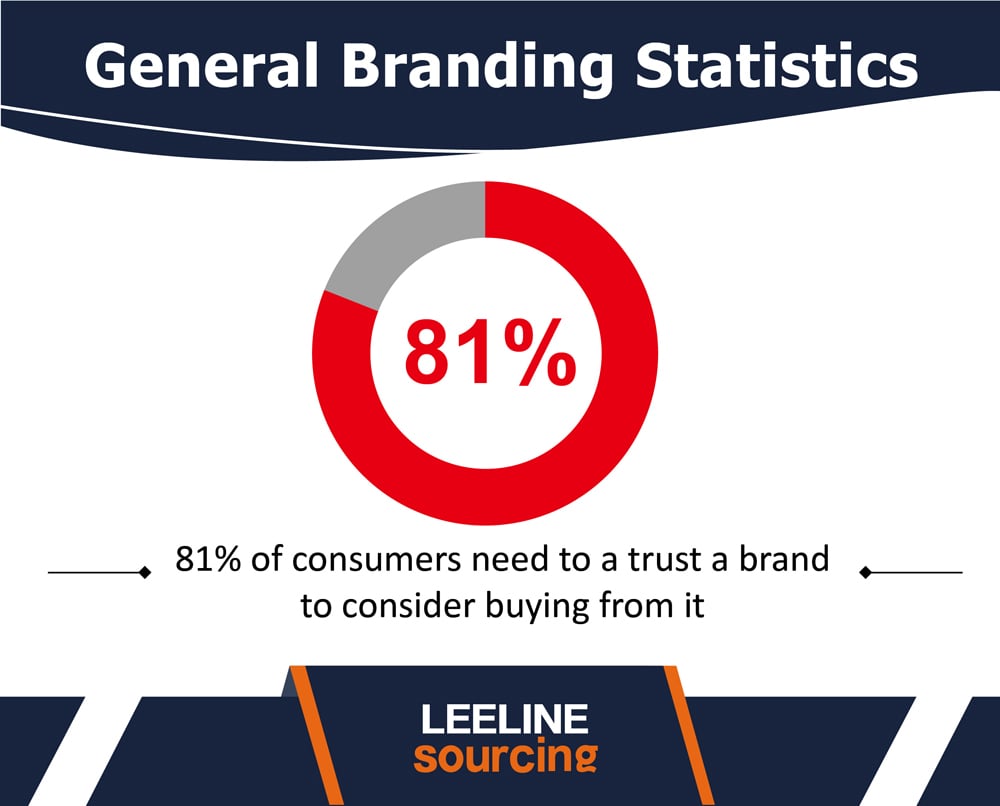
- 53% of CONSUMERS expect brands to take a stand on their problems.
- 81% of consumers need to TRUST before buying. Once they are IMPRESSED with a brand, they show their loyalty and buy products.
- 77% of consumers buy from their SOCIAL MEDIA BRANDS.
- Tesla’s BRAND shot up to 184% in 2021. It is the HIGHEST for any brand to take such a MASSIVE gain in its brand value.
Content Branding Statistics
Branded content drives more RESULTS than non-branded. Moreover, branded video content brings a POSITIVE impression compared to others.
Whatever you use, the goal is to BUILD BRAND AWARENESS.
Isn’t it CORRECT?
Different brands have different goals depending on what they target.
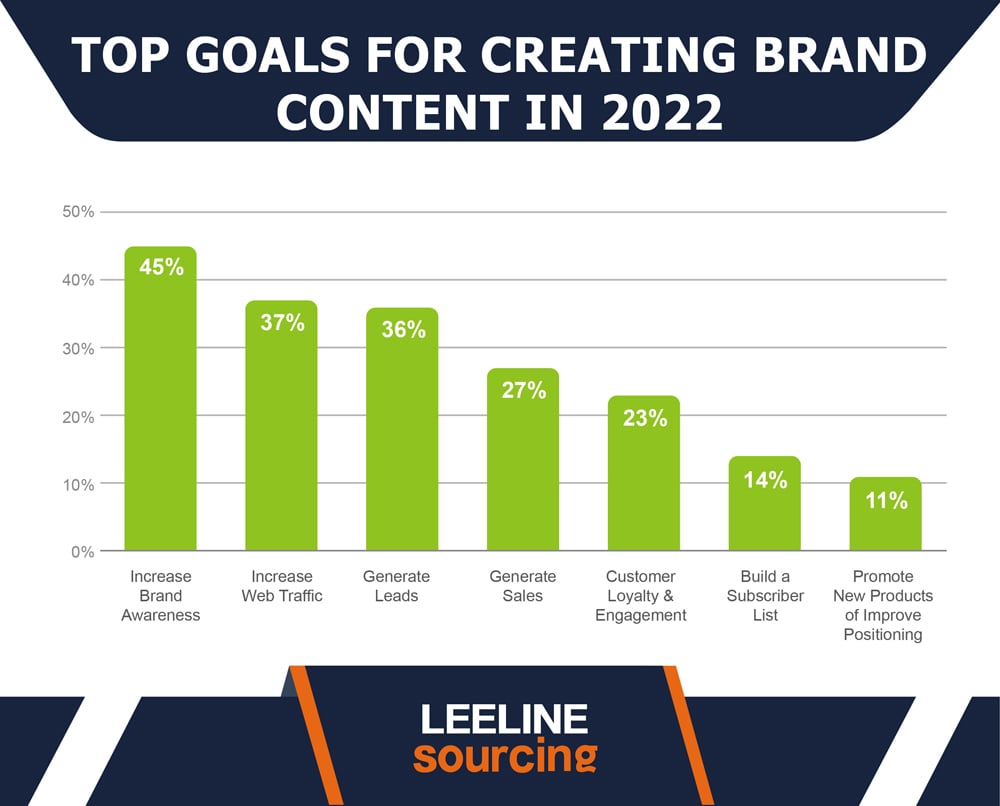
Here are some goals regarding the company BRANDING.
- 45% of the BRANDS keep the brand recognition as a TOP TARGET. It is especially valid for new brands that want to make a PLACE in the market.
- 37% of the BRANDS want to increase their website traffic. Sometimes they have online stores on Shopify; it can be their GOAL also.
- 36% of the BRANDS want to generate leads for their products. It helps them find new customers and increases brand identity among existing customers.
- 27% of brands have the goal of generating sales online or offline.
- 23% of the BRANDS want brand loyalty from the consumers. A strong brand content approach helps them achieve this goal.
- 14% of BRANDS use the content to get more subscribers in their newsletter list. It helps them get better leads through other ways like email marketing.
- 11% of the BRANDS promote new products and improve positioning.
Logo and Color Branding Statistics
“Color improves brand recognition.”
I have heard of this STATEMENT. And it is 100% VALID. If we add the color with the LOGO, it would be a great combination.
Let’s take an example of an Amazon logo.
Amazon has a Black and Orange color in the logo. Whoever describes it will mention the A of Amazon and the colors.
It indicates, what?
It shows how people retain the COLOR CODING with the logo.
One more important point here.
According to the Research, our eyes have a distinct meaning for every color. For example, the Green color shows the safety and eco-friendly systems.
And it is SOMETHING BRANDS target.
You might guess what I am talking about is FALSE. Is that so? Let’s know what the STATISTICS say about a brand logo.
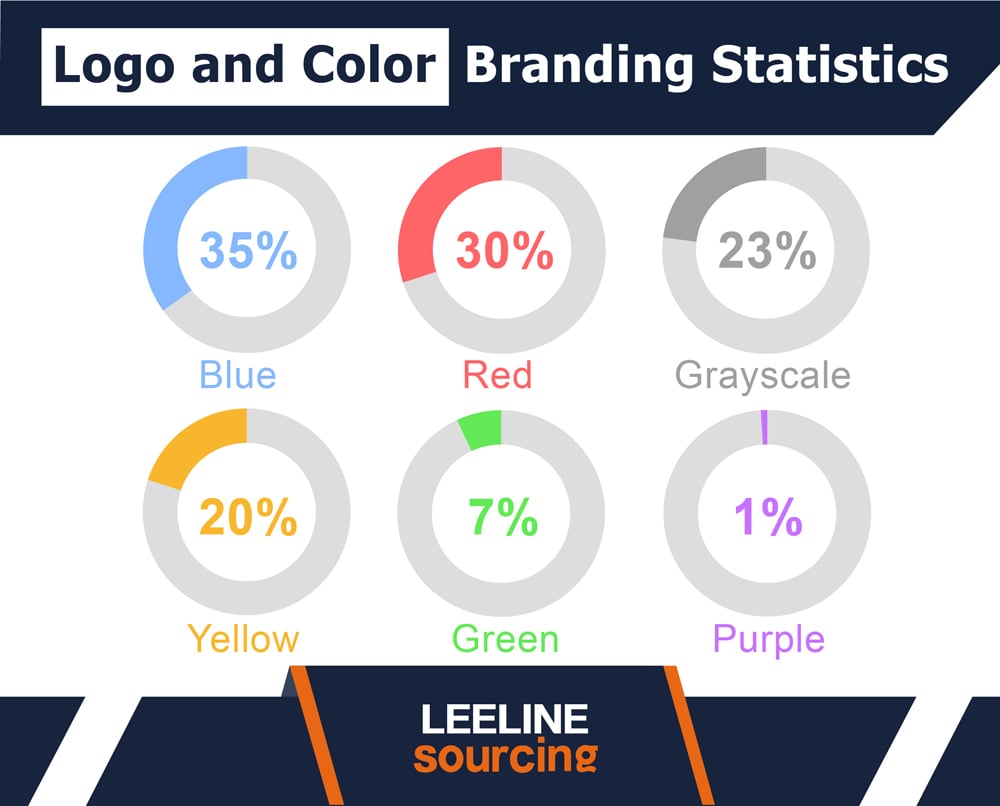
- The top THREE colors the brands target are blue, red, and grayscale.
- Blue has MAXIMUM popularity with a 35% contribution. After that, we consider RED a primary color for the 30% brand.
- Grayscale is third on the LIST. 23% of brands have Grayscale color in their logos.
- Yellow is FOURTH on the list with a 20% contribution. Green constitutes 7%, while purple is 1% only.
- According to research, 90% of the time, we react to the COLOR. Our nerves define the brand with its color.
- Color influences the decision of 80% of consumers. A brand increases its sales with the RIGHT COLOR THEME.
- Small businesses pay up to $500 for the LOGO design. About 67% of SMBs do that. 18% of companies are ready to INVEST $1000 In designing a logo.
- 60.8% of the MARKETERS believe the logo to be an IMPORTANT part of branding and marketing. It helps drive sales and improve brand recognition.
Social Media Branding Statistics
There are around 4.76 BILLION social media users. And there are approximately 50 or more SOCIAL MEDIA PLATFORMS.
Doesn’t it make SOCIAL media your FAVORITE platform for building brand awareness?
Facebook. Instagram. Twitter. All social media sites allow influencer marketing.
I have a question. Which one do you use? I guess the FACEBOOK. It is because this social media gives AFFORDABLE advertising plans.
Let’s know the social media branding to improve brand visibility.
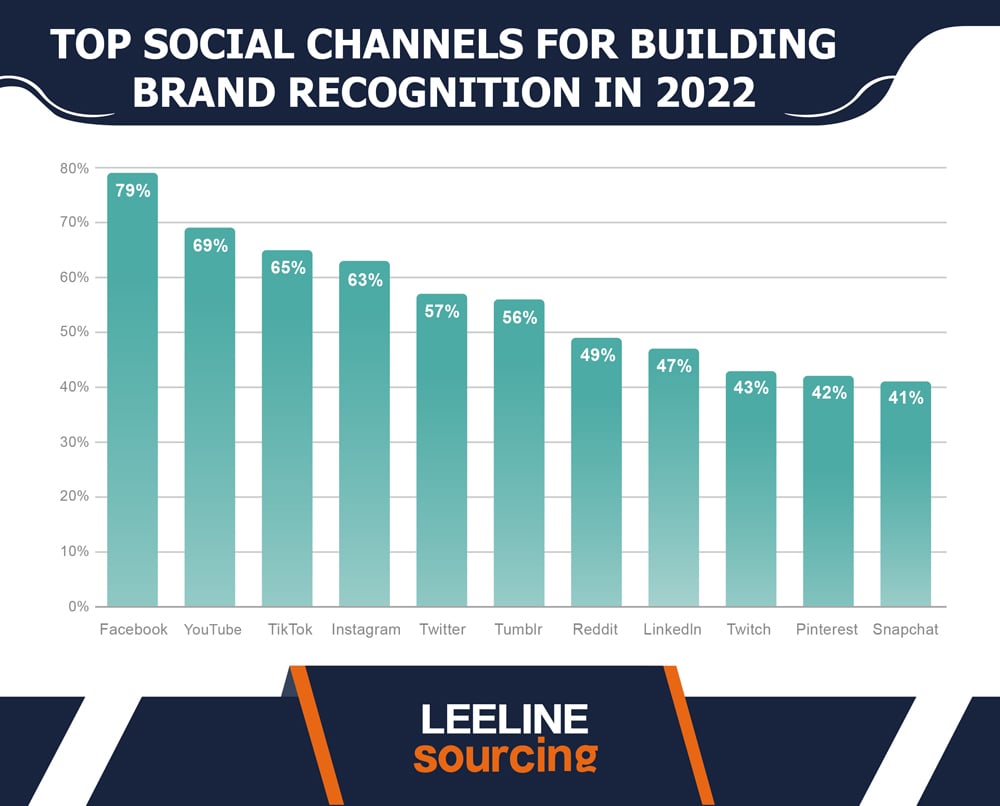
- 79% of the BRANDS consider Facebook as their favorite social media. A solid social media presence gets them potential customers.
- Youtube is second on the LIST of social media marketing. 69% of the BRANDS consider it a primary channel for brand awareness.
- TikTok has emerged as a TOP influencer. It has 65% of the BRANDS for social media advertising and marketing, making it a must-know platform for anyone seeking to learn how to go viral on TikTok.
- Instagram is not FAR AWAY from TikTok. It has got billion social media users. 63% of the brand use for brand awareness among loyal customers.
- Twitter is 5th on the LIST. Pretty decent brands use it for content marketing and trends. It has 57% of the consumers.
- Tumblr is a WELL-known site for branding. It has got 56% of the consumers.
- Some other popular social media channels include Reddit, LinkedIn, Twitch, etc.
Marketing Branding Statistics
Have you got a BRAND? Isn’t it time to improve brand visibility?
What social media channel will you use? It is not SOCIAL media but the general way to use it.
For example, you use GOOGLE ADs. And it is a GOOD way for marketing. Content marketing and digital marketing have Dominated the way.
Let’s know what brands do for their branding strategy.
- Around 10,698 branding agencies are working around the GLOBE. Three thousand seventy-nine agencies work alone in the US.
- 94% of consumers use PERSONALIZED marketing. Brand marketers believe it drives more results than anything else.
- 70% of MARKETERS have a top goal of increasing brand awareness. 47% implement BRANDING EFFORTS to achieve their dreams among the target audience.
- A consistent brand presentation can increase Sales and recognition by 20%. 32% of the brand agree to this fact for marketing purposes.
- 47% of the BRANDS publish off-brand content every year. It happens a FEW times a year. Content marketing with an off-branding strategy achieves some goals. However, 23% of the BRANDS don’t follow this branding strategy for brand recognition.
- Brands use 46% of MOBILE ads budget on branding online on many sites.
Employer Branding Statistics
A company runs on what? Suppose you are MARK ZUCKERBERG.
You are nothing without your TEAM. And a team might comprise different skills experts. For example, it will have:
- Marketing specialists
- Developers to develop Facebook.
- Debugging team to remove the bugs in the apps.
- Management teams
- Customer service teams
Based on what is EXPECTED and required, there can be several teams.
And what if you do not behave well with your employees? It is doing nothing except destroy your BRAND.
This happens with many brands. That is why I have listed employer branding statistics.
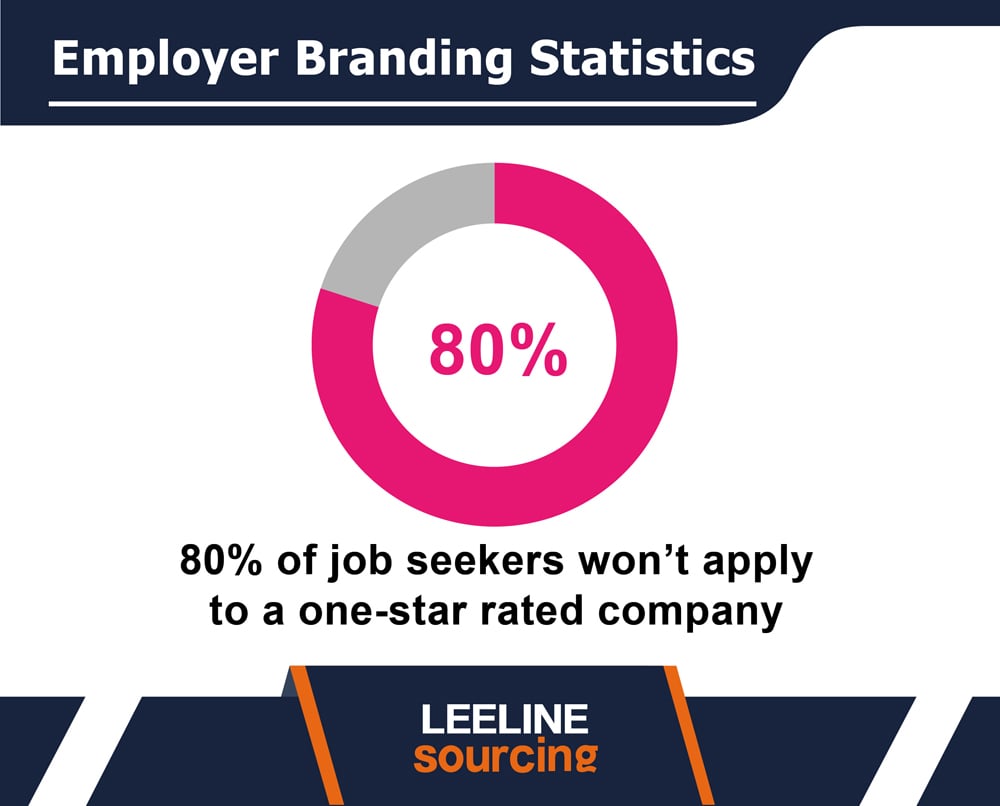
- According to Glassdoor, 86% of professionals know about the brand. They read the reviews on the ONLINE SITES before applying to a company.
- Suppose a company has a one-star rating for employer brand behavior. In that case, 80% of job seekers won’t dare apply for the VACANCY.
- 33% of women don’t apply with BAD-rated companies. 22% of male job seekers do that. It is less than the females.
- 96% of the brands NOTICED their sales were down. It is due to poor employer behavior. And 64% of consumers don’t use such brands.
- Strong employer branding increases brand recognition. 50% more job seekers apply to such a BRAND.
Customer Branding Statistics
To understand customer behavior, think like a CUSTOMER.
Suppose you have to buy a Television from the market. What will you do?
Set up some budget. Keep expectations. And ensure it comes from the REPUTED brand, such as Sony, LG, etc.
Is that so?
You have got what a CUSTOMER thinks. Buying a PRODUCT is all about QUALITY and brand TRUST.
Let’s know the detailed eye-opening branding statistics.
- 53% of CONSUMERS pay close attention to the BRAND when purchasing smartphones. When purchasing a television, 48% do that. And 47% have an eye on the BRAND when buying cars.
- Customers pay 90% MORE to trusted brands compared to local brands.
- 57% of customers rely on the different services a brand provides.
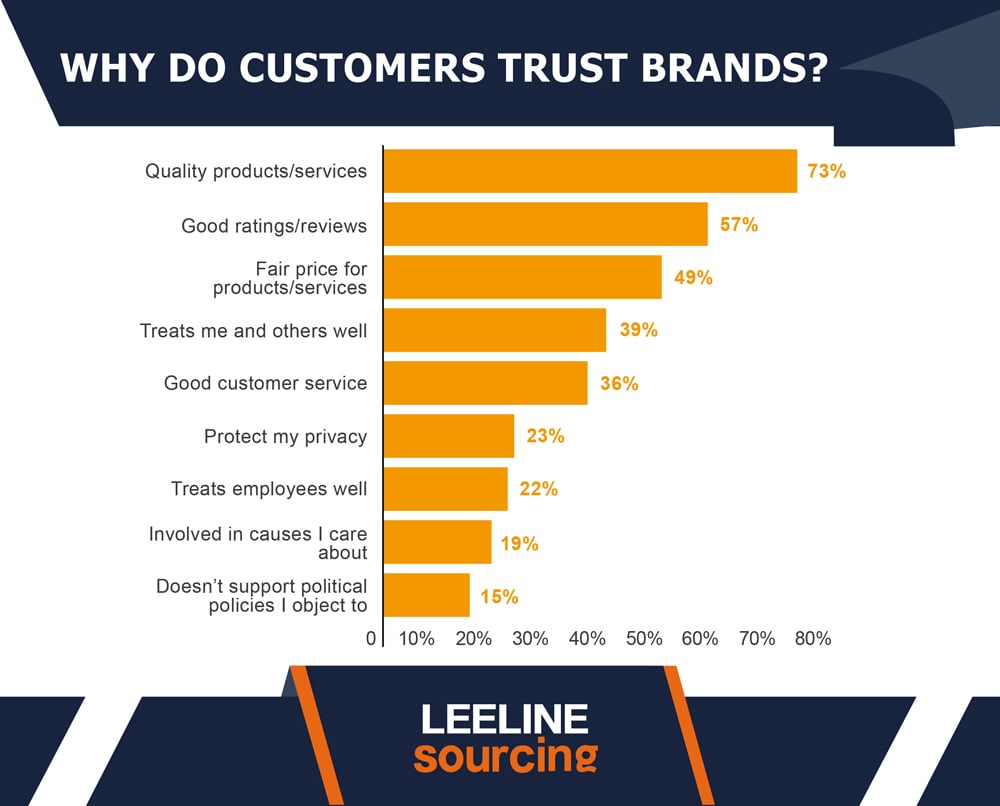
- 73% of consumers buy from a brand with QUALITY products and services.
- 57% of customers count on Good reviews on a product.
- 49% look for a COMPETITIVE price. They ensure the product price is FAIR and suits their budget.
- 39% of consumers purchase based on the GOOD service of a brand
- 36% of customers rely on EXCELLENT customer service. If the customer service is UP TO mark, they buy. Otherwise, they leave the brands.
- If a brand protects the CUSTOMER INFORMATION, they may buy products. 23% of the customers do such things.
- If a brand treats its employees well, it can be another factor to CHOOSE. 22% of consumers think about it.
- 19% buy from the brand if the brand cares about them.
- 15% support the non-biased brand from political aspects.
- Too much promotion can affect the BRAND values. 45% of people unfollow brands that do too much advertising online.
- 82% of the consumers consider the BRAND to be their partner. They share values. Consider the better responses. And want them to be NEUTRAL in any case.
Small Business Branding Statistics
Everyone can’t start a MICROSOFT like a brand. It is the small business that helps in the beginning.
Microsoft has been a SMALL BUSINESS in the beginning.
Therefore, I have got some branding statistics related to small businesses.
- Social media advertising is the TOP marketing strategy for a small business. Almost 75% of SMBs invest in Facebook ads or Instagram advertisements.
- 34% of small businesses have VIDEO marketing to increase brand recognition. It helps them get more customers.
- 73% of BUSINESS use Facebook as their social marketing strategy.
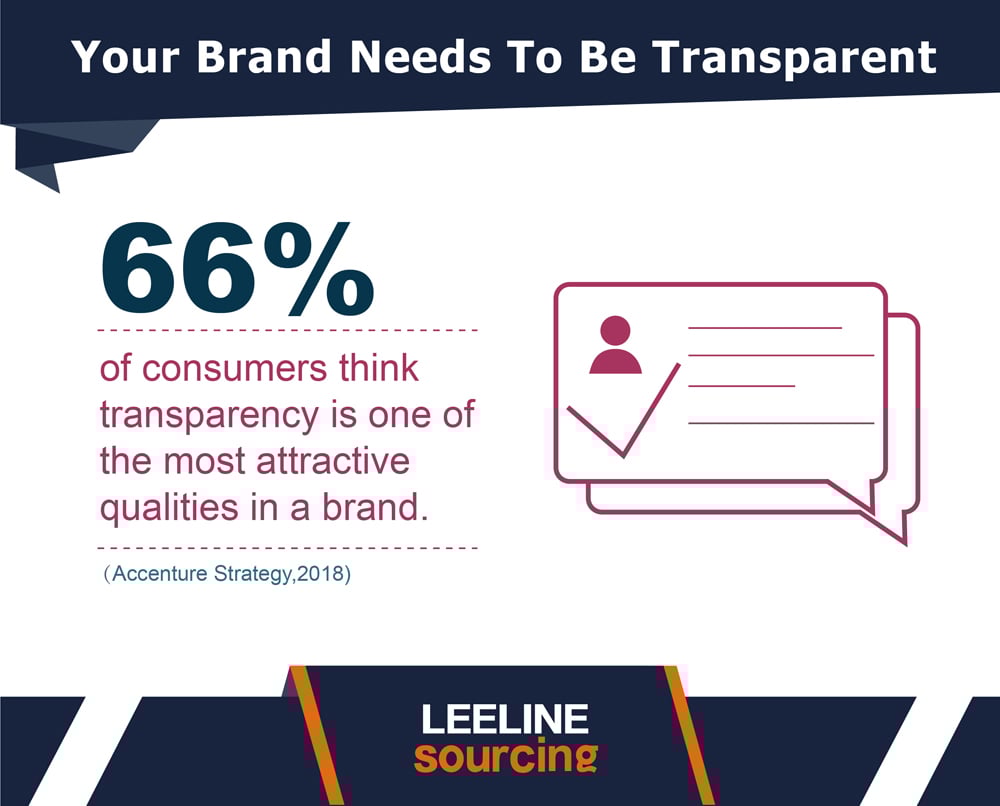
Brand Transparency Statistics
Customers expect a BRAND to be reliable and helpful. And it is POSSIBLE when your brand is more transparent.
At every point, customers know what they are BUYING. And what they should buy.
Here are more statistics compelling the brands to keep their transparency.
- 66% of consumers think they trust brands with more transparency. They buy products from such a brand and SHOW them loyalty when showing support.
- In a survey of 2000 people, 94% of the CUSTOMERS remain LOYAL to a transparent brand.
- Around 39% change their BRANDS when the brand is not FULLY transparent in front of them.
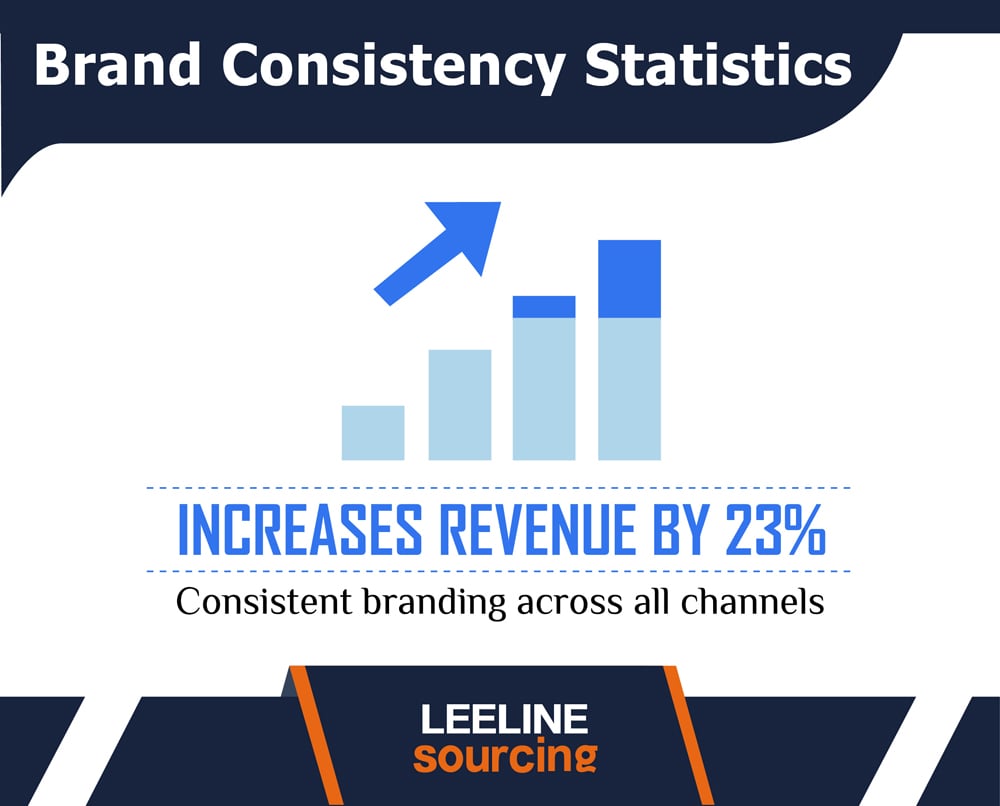
Brand Consistency Statistics
A brand can ONLY be successful when it comes up with continued efforts. Consistent branding drives more results.
For example, I run my dropshipping BRAND. It takes 3-5 months for a BRAND to be successful. And I have to be CONSISTENT and keep patience during that period.
Consistent brand IMAGE brings up some PERMANENT customers. Let’s know what customers say about the CONSISTENT branding.
- With consistent brand, brand sales increase EXPONENTIALLY. Bfand can increase revenue by 23% while consistently delivering quality among customers.
- 87% of the consumers think about the CONSISTENT experience from the brands.
- Communication is a CONSISTENT brand aspect among 81% of global brands.
Brand Personality Statistics
A great Brand strategy ENSURES a better personality.
Your brand must provide more value to the PERSONAL requirements than business.
We have got some statistics relevant to this too. Let’s take a look.
- Personally, relevant CONTENT influences purchase decisions more. 87% of the consumers agree with this fact.
- 81% of the CONSUMERS prefer brands who listen to their perspective.
- 77% of CONSUMERS prefer brands with a more PERSONALIZED experience.
- 75% of US consumers become loyal to their FAVORITE brands. Their reason is that brands listen to their requirements.
B2B Branding Statistics
B2B brands are quite DIFFERENT from B2C. In B2B, the interaction occurs between the businesses. The inventory orders are in the BULK QUANTITY.
We have got some statistics related to B2B branding.
Let’s check.
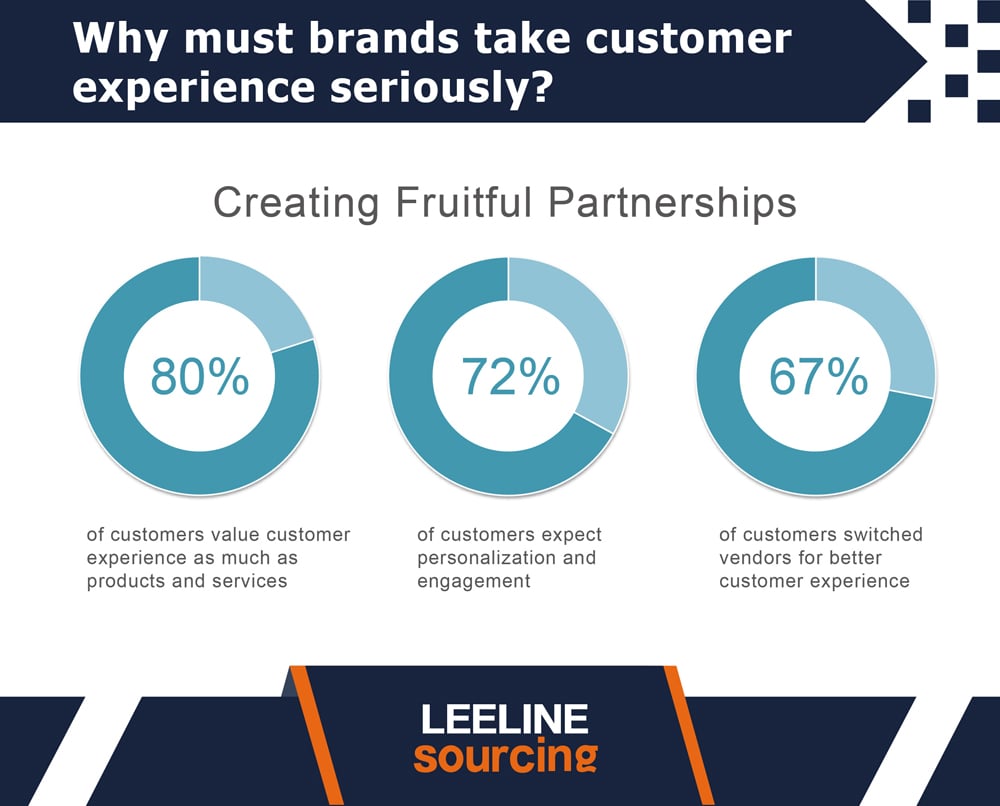
- 80% of B2B customers value EXPERIENCE more than anything. They prefer the experience to the product and services. Good experience brings more customers to B2B brands.
- 72% of customers expect PERSONALIZATION and engagement. If a brand provides them with personalization, they’d be happier and more loyal.
- 67% of consumers MOVED from one vendor to another due to bad customer experience. Customer experience changes the buying decision.
- 78% of US buyers use Amazon to buy products from B2B suppliers.
- 36% of consumers use Alibaba to source their B2B suppliers.
- 72% of B2B executives understand the CUSTOMER REQUIREMENTS. They think customers want tailored solutions to fulfill their requirements.
B2C Branding Statistics
Have you heard about B2C companies? Different retailers in your AREA are B2C.
In actuality, it is the deal between the BRANDS and the customers. There is no limit on the PRODUCT QUANTITY. It can vary from one item to one HUNDRED or more.
Curious to know some detailed B2C branding statistics. Let’s take a look.
- 66% of CONSUMERS pay more to specific B2C brands. Those brands should be SOCIALLY responsible.
- Brands that IMPROVE the QUALITY of life perform better. They might jump by 120% in the MARKET due to their sustainability.
- Low product quality influences the brand’s reputation. 14% of consumers move to other BRANDS due to low-quality products.
- 70% of CONSUMERS rely on helpful customer service from a B2C brand. Buying occurs based on the EXPERIENCE of a brand.
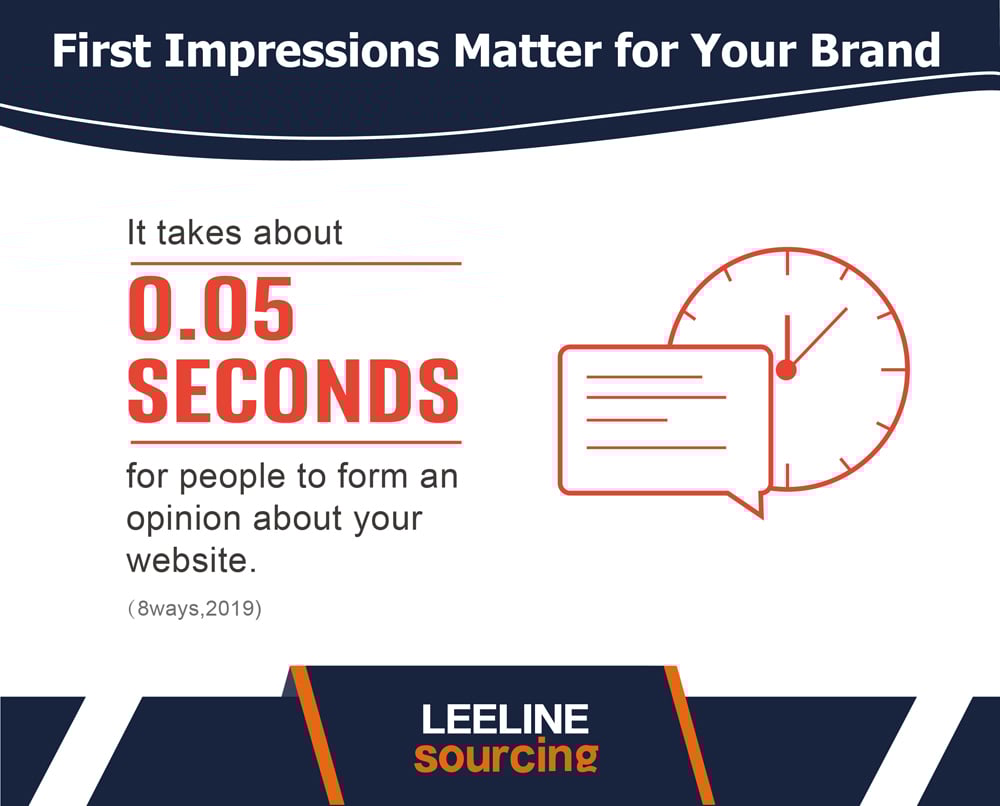
Importance of First Impression on Brand
There is a famous quote among the School Children. I heard it during my school tenure.
“First Impression is the LAST IMPRESSION. “
It fits the BEST here. A brand has to BUILD an emotional connection with the buyers in the FIRST meeting. It is how brand identity can be MORE EFFECTIVE.
Here are some stats.
- It takes 5-7 impressions for a BRAND to be more powerful. After that, consumers expect better help in brand building.
- Fifty milliseconds take for a CONSUMER to develop an opinion about a brand.
- 13% of consumers pay 50% or more for a GOOD impression brand.
What’s Next
Many BRANDS are trying to stay ahead of their competitors. The sole purpose is to KEEP on moving with the GOOD BRANDING services.
When a brand consistently DELIVERS, it is possible only then.
We have LEARNED this already. Do you want to know more stats?
Visit our website. You’ll know more exciting stats like that.