Facebook is our FAVORITE social media channel. I even spend SEVERAL hours browsing Facebook.
It is not ONLY me. But 2.9 billion other people also do the SAME. Multiple Facebook statistics indicate the SAME story.
“Facebook has 2.9 BILLION monthly active users in Q1 2023.”
A serious QUESTION here. Will it reach the 3 BILLION monthly active users? I guess in 2023; we MIGHT see Facebook achieve this milestone.
Do you want to know more about FACEBOOK STATISTICS?
Ride the TIDE. This article explores Facebook statistics from RELIABLE sources.
Let’s learn more.
- Facebook User Statistics
- Facebook Usage Statistics
- Facebook Demographics Statistics: Age and Gender
- Facebook Growth Statistics
- Facebook Video Statistics
- Facebook Engagement Statistics
- Facebook Consumer Behavior Statistics
- Facebook Device Statistics
- Facebook Financial Statistics
- Facebook Business Statistics
- Facebook Ad Statistics
- Facebook Marketing Statistics
- Facebook Messenger statistics
- Average Time Spent on Facebook
- Discover Products through Facebook
- What’s Next
Facebook User Statistics
There are SO MANY social media sites. Here is the LIST OF SOCIAL MEDIA SITES I use.
- Youtube
What social media sites do you use?
There are MULTIPLE reasons why people use social media platforms. The biggest one is SOCIAL ENGAGEMENT.
You got the FACEBOOK reels. Hundreds of MEMES entertain till your ABDOMINIS muscles ache.
Among all, can you guess who is on the TOP?
Curious?
Here are some stats on SOCIAL MEDIA platforms.
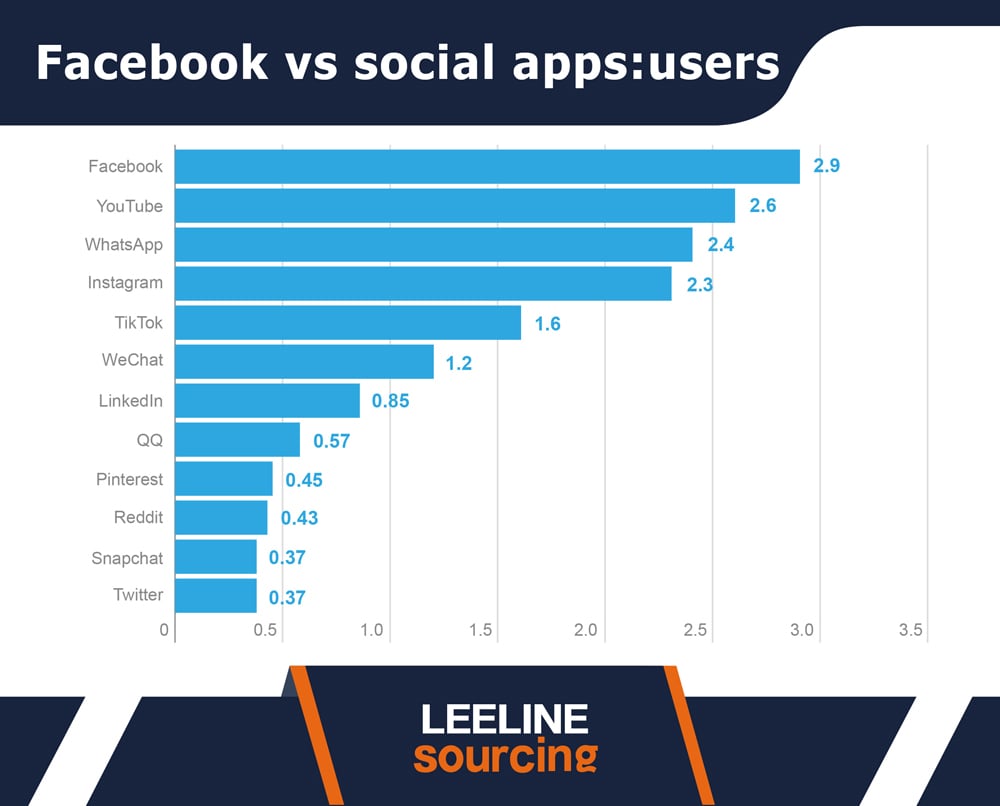
- There are AROUND 4.76 billion social media users. By 2027, the forecast says it will reach 6 BILLION users. Among them, 2.9 billion use FACEBOOK. More than 60% of SOCIAL media users only use Facebook.
- Facebook is the CLEAR CUT winner for the HIGHEST Number of users. Youtube comes in at the SECOND number with 2.6 billion users. It is due to YOUTUBE shorts and videos.
- WhatApp is not LAGGING. It has the THIRD MOST share with 2.4 BILLION active users. It is around 50% of the TOTAL share by social media users.
- The other TOP social media platforms include Instagram and TikTok. Instagram has 2.3 BILLION USERS active monthly. TikTok is behind INSTAGRAM. It has 1.6 billion users and is rapidly expanding due to HIGH engagement.
- India has the MOST number of Facebook audience. It has around 450 MILLION active Facebook users each month. The US is second on the LIST with 266 million ACTIVE Facebook users.
Facebook Usage Statistics
The Internet is COMMON nowadays. Installing Facebook or having a Facebook account is NO big deal for Generation Z.
But that was not the CASE with Millennials.
It is the main reason behind the 2.9 billion active Facebook users. Over The years, these will CROSS 3 billion.
Can you even believe it?
What if HALF OF THE POPULATION uses Facebook? It is a NO LONGER HIDDEN thing.
Here are MORE STATISTICS to prove my POINT.
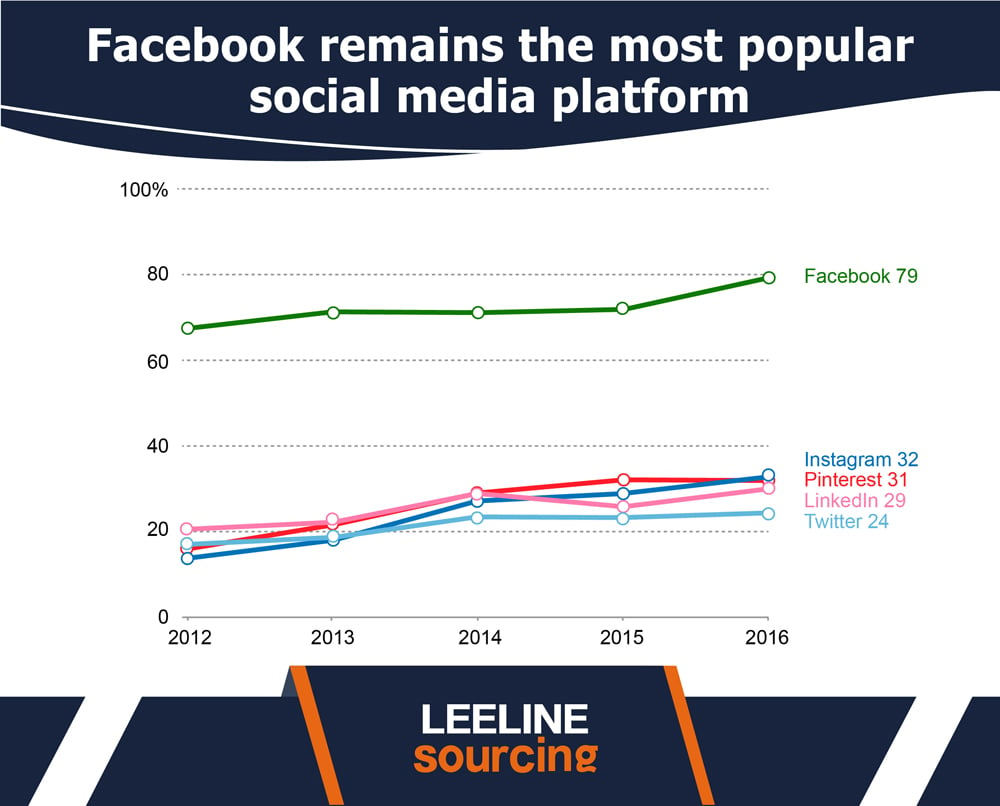
- Facebook is the MOST POPULAR social media platform. 79% of ADULTS use Facebook. Instagram occupies around 32% of ADULTS. It is on the SECOND number. Pinterest has a SHARE of 31%.
- Facebook is the THIRD MOST downloaded app in the WORLD. It has over 5 billion DOWNLOADS on the Play Store. It becomes around 65% of the TOTAL population.
- 40% of the TOTAL population uses Facebook. The number of MONTHLY active users has ALREADY exceeded 2.9 billion—no time to CROSS the 3 billion mark.
- 60% of TOTAL SOCIAL MEDIA users exist on FACEBOOK. That means it shares a MAJOR PORTION for the
- 85% of total smartphone users have FACEBOOK installed on their smartphones. 98.5% of the USERS access Facebook from mobile devices.
- Teen usage of FACEBOOK in the US has declined. In 2016, 71 of the TEENS used Facebook. In 2022, it decreased to 32%. A drop of more than 50% has been noticed.
- Facebook stories are a FAVORITE topic for people. Over 1 billion FACEBOOK stories are shared on Facebook.
Facebook Demographics Statistics: Age and Gender
Facebook demographics are KINGMAKERS!
Facebook is POPULAR among young adults and OLDER PEOPLE. But there are SOME DIFFERENCES.
For example, it is not much more prevalent in older people than young adults.
The age group is NOT ENOUGH to sort out the TOTAL Facebook users. Instead, we have got ANOTHER criterion. It is the GENDER.
Let’s know the detailed stats on Facebook regarding age and gender.
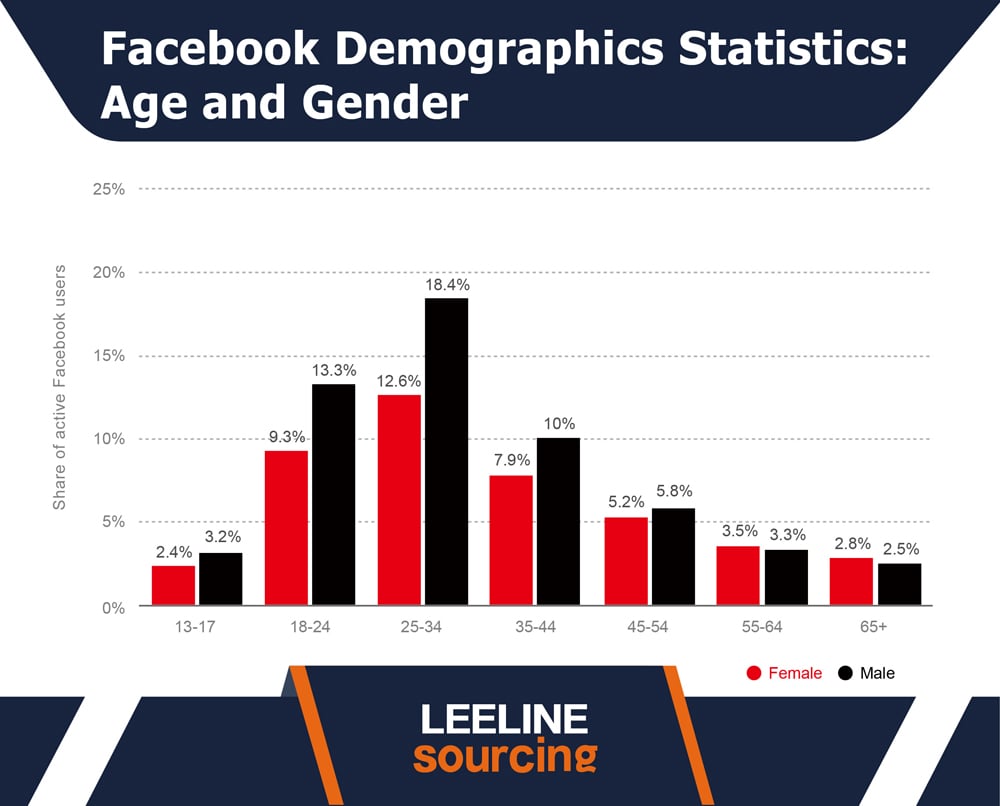
13-17 Age group
In 13-17 years, we can see the DOMINATION of the males.
In 2021, the Male contribution was 3.2%, while the female was 2.4%.
In 2023, it DECREASED A BIT. Now the male contribution is 2.7%. Females are BEHIND males with 2.1%.
18-24 Age group
It has the SECOND MOST contribution.
Still, the males are the WINNERS.
In 2021, the females had a PERCENTAGE of 9.3 while males had a percentage of 13.3.
In 2023, it declined. The male contribution is 12.6%, while females have 8.9%.
25-34 Age Group
It has TOPPED the charts.
In 2021, female users were 12.6%, and male users were 18.4%.
In 2023, we will have a DIFFERENT picture. The female users are 17.6%, and the male users are 12.3%.
35-44 Age Group
In 2021, the number of female users was 7.9%, and male users were 10%.
In 2023, female users are 8.5%, and male users are 10.9%.
45-54 Age Group
In 2021, female users were 5.2%, and male users were 5.8%.
In 2023, we have a DIFFERENT snapshot. The female users are 5.5%, and the male users are 6.1%.
55-64 Age Group
In 2021, female users were 3.5%, and male users were 3.3%.
In 2023, we see a DIFFERENT CASE. The female users are 3.8%, and the male users are 3.5%.
65+ Age Group
In 2021, female users were 2.8%, and male users were 2.5%.
In 2023, we observe differently. Female users are 3%, and male users are 2.6%.
Facebook Growth Statistics
Facebook hasn’t ACHIEVED billions of USERS in a SINGLE DAY.
It is a JOURNEY of years. In the decade 2000, it had MILLIONS of Facebook users worldwide.
In the decade 2010-2020, it TOUCHED the mark of BILLIONS.
Want to know the current growth?
Here it is.
- From Oct 2022 to Jan 2023, it has shown an increase. 5 MILLION new Facebook users have been added. The quarterly growth rate is 0.2%.
- In a year, it has demonstrated an increase of 51 MILLION FACEBOOK USERS. It has a growth rate of 1.8% globally.
- Facebook’s daily active users have ALSO increased by 16 million. The daily active users’ growth rate is 0.8%.
Facebook Video Statistics
Facebook VIDEO is the main thing that FASCINATES us.
I daily watch 10-15 videos of 2-5 minutes. On a FREE DAY, it is around 20-30 videos. Do you know what I like the MOST?
It is a FACEBOOK video based on memes. Memes are not the ONLY CATEGORIES. Instead, we have Politics, General interests, etc.
Want to know the STATS regarding this?
Here are different stats regarding the videos.
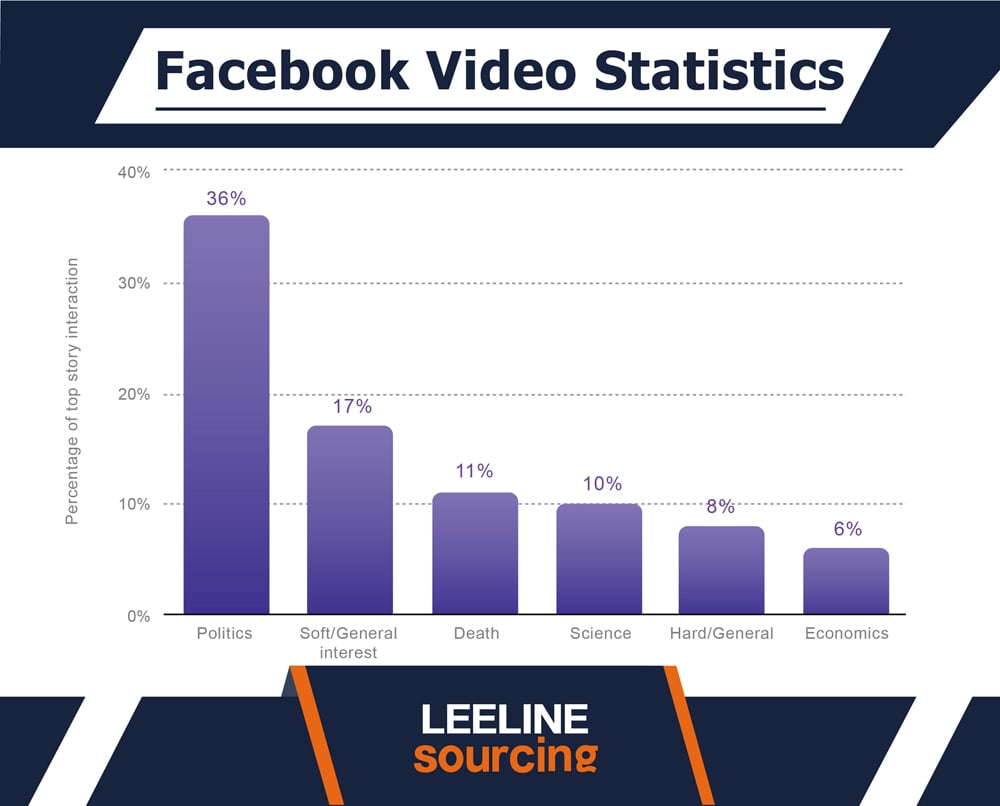
- Politics is the TOP MOST category with the utmost interest. It TOPS the chart with 36% of people watching video posts in this category. The general interest lies SECOND on the list. It shares 17% of the TOTAL interest for the video posts. Other types include Death, Science, Economics, etc.
- More than 2 BILLION USERS watch the videos daily. It can be whether the LIVE videos or the video posts.
- People don’t like the LONG VIDEOS. Facebook videos with a LENGTH of 2-5 minutes create the maximum engagement.
- 12% of the BRANDS use live videos on FACEBOOK. 81% of the BUSINESS prefer Facebook videos for their product marketing.
- Video posts are EQUALLY crucial as photo posts on the Facebook app.
Facebook Engagement Statistics
A FACEBOOK user doesn’t consider FACEBOOK as a mere social network.
Instead, it is:
- Video app
- Photo app
- Meeting with the NEW PEOPLE
- Connect yourself through the Facebook messenger app.
- Facebook Stories posts
There are MANY MORE FEATURES. I love them all.
But what is the MOST MESMERIZING thing? Is it a video post or a link post?
Can you guess it?
If not, here are some AUTHENTIC stats from Locowise.
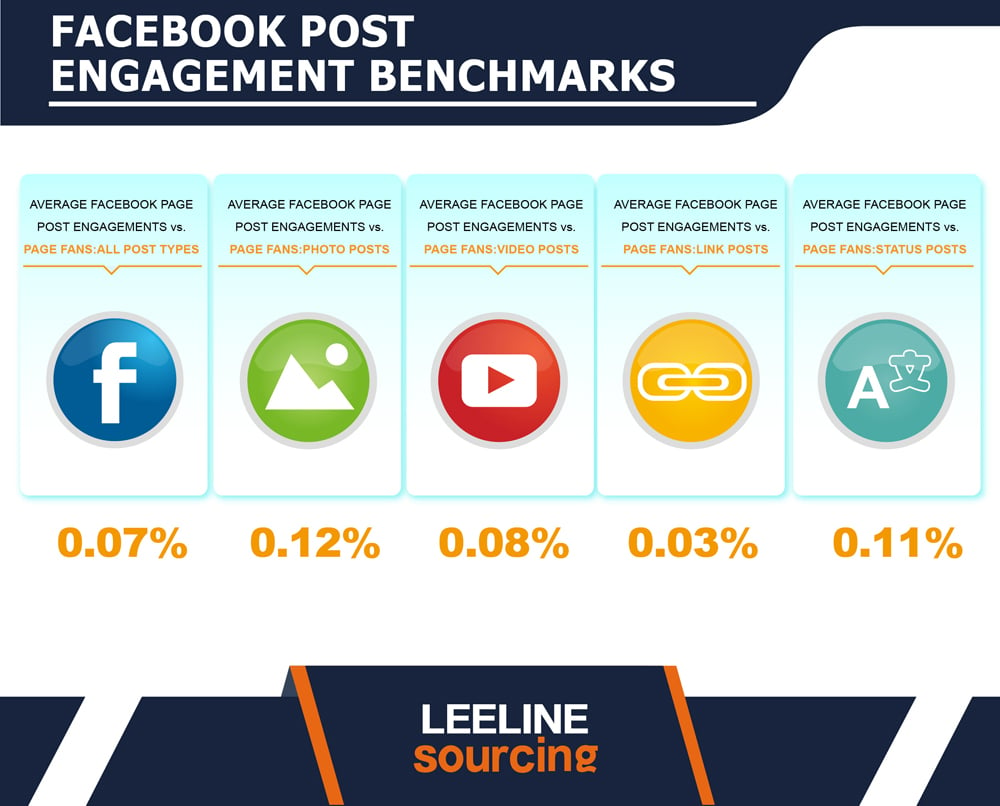
- The average Facebook page engagement is 0.07%. It becomes roughly 1 engagement for every 1429 people following a SINGLE PAGE. It is valid for all the CATEGORIES like status posts or links.
- The average Facebook page engagement for Photos is 0.12%. It is around 1 engagement per 833-page followers.
- The average Facebook page engagement for Videos is 0.08%. It becomes a ROUGHLY 1 engagement out of 1250 followers of a page.
- The average Facebook page engagement for Link posts is 0.03%. It is around 1 engagement out of 3,333 followers of a PAGE.
- The average Facebook page engagement for status posts is 0.11%. It becomes 1 engagement in every 909 followers on a PAGE.
Facebook Consumer Behavior Statistics
Facebook is the HABIT.
Scrolling posts brings up Facebook Ads. And the Facebook ads bring up the RELEVANT products.
It increases the PROBABILITY of sales.
That is why brands like Louis Vuitton TARGET LARGE Facebook audience size.
Here are some stats regarding this.
- Facebook has the HIGHEST number of consumer buyers. It has around 65.7% of US buyers. High Facebook engagement enables FAST MARKETING for brands.
- When consumers WANT to buy something, they use FACEBOOK. Search the products. Check the reviews and buy them. About 19% of US consumers agree with this fact.
- Most FACEBOOK USERS buy products from Sponsored Facebook ads. About 71% agree with this.
Facebook Device Statistics
Do you have a MOBILE PHONE? I am 200% SURE you have a FACEBOOK installed.
Is that true?
Facebook launched as a DESKTOP website. But over TIME, it has reached our devices.
Facebook has DIVERSIFIED its access to the SOCIAL MEDIA LANDSCAPE. For example, you have an IOS app.
Now, most people access FACEBOOK through their mobile phones.
I have PROOF of that. Here it is.
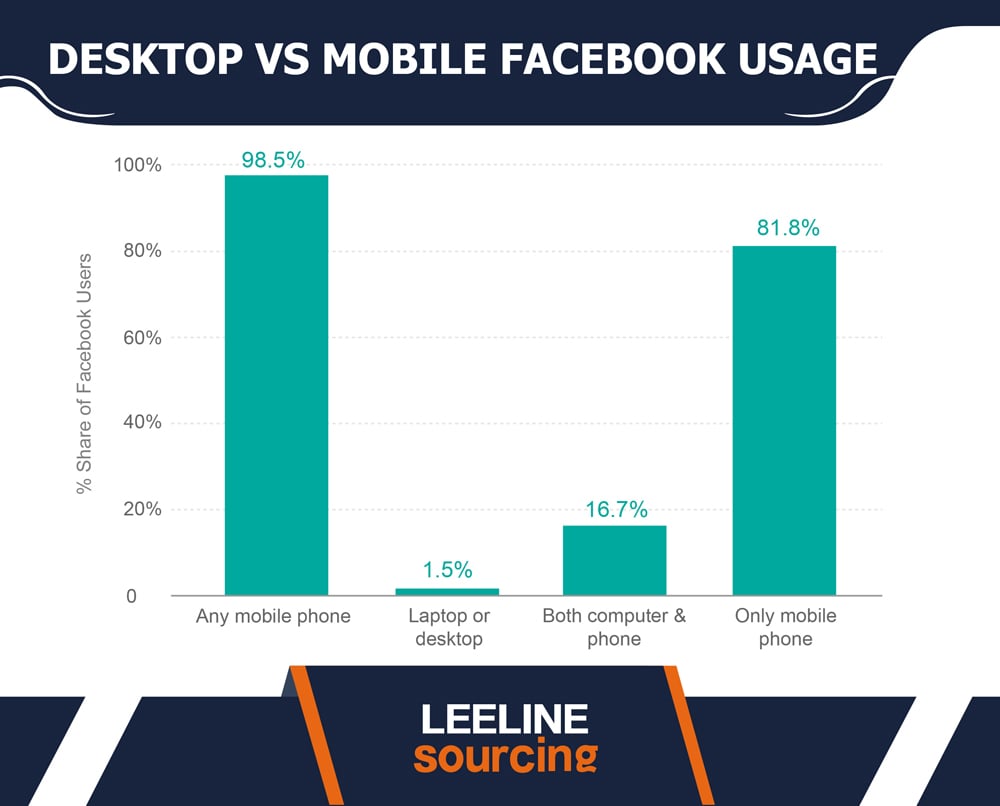
- 98.5% of FACEBOOK USERS access Facebook through mobile devices. These can be any phone. 81.8% of those use only the MOBILE device to use FACEBOOK.
- 16.7% of the TOTAL FACEBOOK users access it through the desktop. It is FAR BEHIND the most percentage on the PHONE.
- Around 28% of the USERS use both devices. They sometimes use the MOBILE and sometimes desktop to use Facebook.
- Tablets and LAPTOPS are third on the LIST. They have a MERE contribution of 1.5%. It is even miles BEHIND the mobiles.
Facebook Financial Statistics
Facebook has BILLION OF USERS. But when we project the TOTAL map on the globe, we have DIFFERENT STATS.
For example, in 2017, the US had around 282 million people. All these accessed the Facebook apps in multiple ways.
Here we are in 2023. So I am going to demonstrate to you from 2017 to 2026.
Want to know the PROGRESS of users in the US?
Ready? Let’s check.
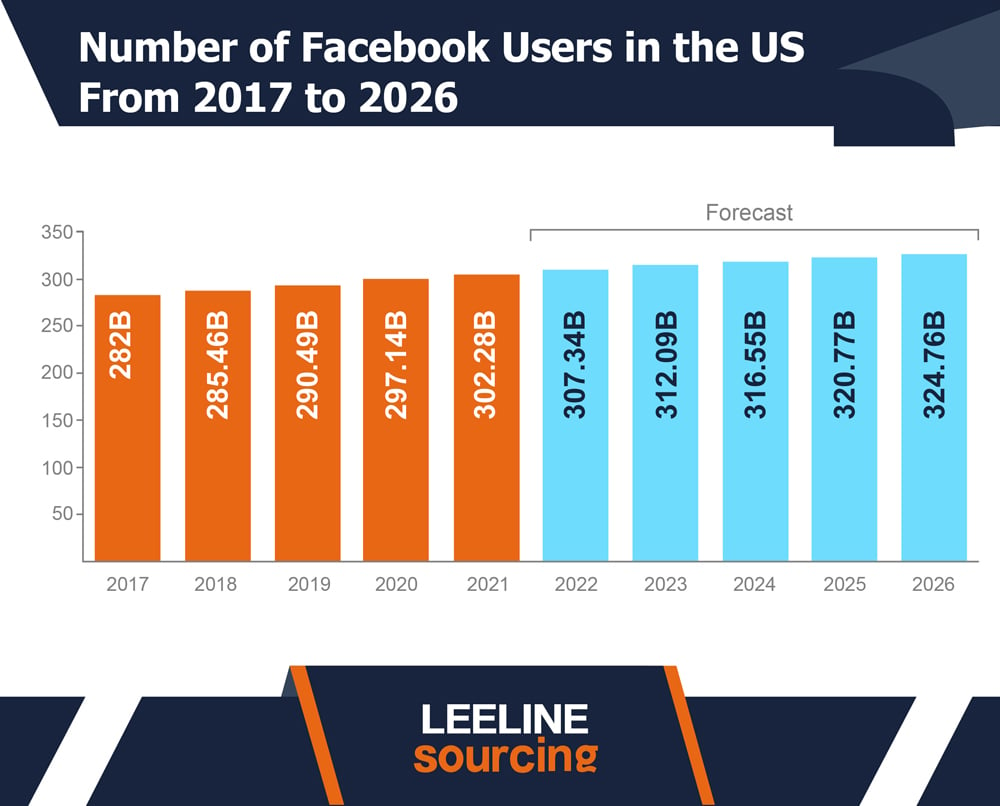
- In 2017, Facebook had 282 monthly active users.
- In 2018, there was a SLIGHT INCREASE. It reached 285.46 MILLION ACTIVE FACEBOOK USERS.
- In 2019, the US had 290.49 million ACTIVE FACEBOOK USERS monthly.
- In 2020, it reached 297.14 million MONTHLY ACTIVE USERS on FACEBOOK.
- In 2021, there was a SLIGHT INCREASE. It reached 302.28 million users.
- In 2022, Facebook had 307.34 million active users monthly.
- In 2023, there was a slight INCREASE. It reached 312.09 MILLION ACTIVE USERS on FACEBOOK.
- In 2024, the US had 316.55 million ACTIVE USERS monthly.
- In 2025, it reached 320.77 million active USERS on FACEBOOK.
- In 2026, there was a SLIGHT INCREASE. It reached 324.76 million Facebook users.
Facebook Business Statistics
Facebook adoption is MORE IMPORTANT among businesses.
Do you know why?
If a PLATFORM has 2.9 billion users, don’t you think it is KEY for targeting? You get the TARGET AUDIENCE. Do the marketing. And drive more people to your BRAND.
Such a BIG PLATFORM is critical for businesses. Moreover, Facebook’s TARGET audience has proven results.
Let’s compare the FACEBOOK businesses with other social media platforms.
- Facebook is OWNED by the META GROUP. Meta’s global revenue is 116 billion USD annually. And a significant share is from FACEBOOK.
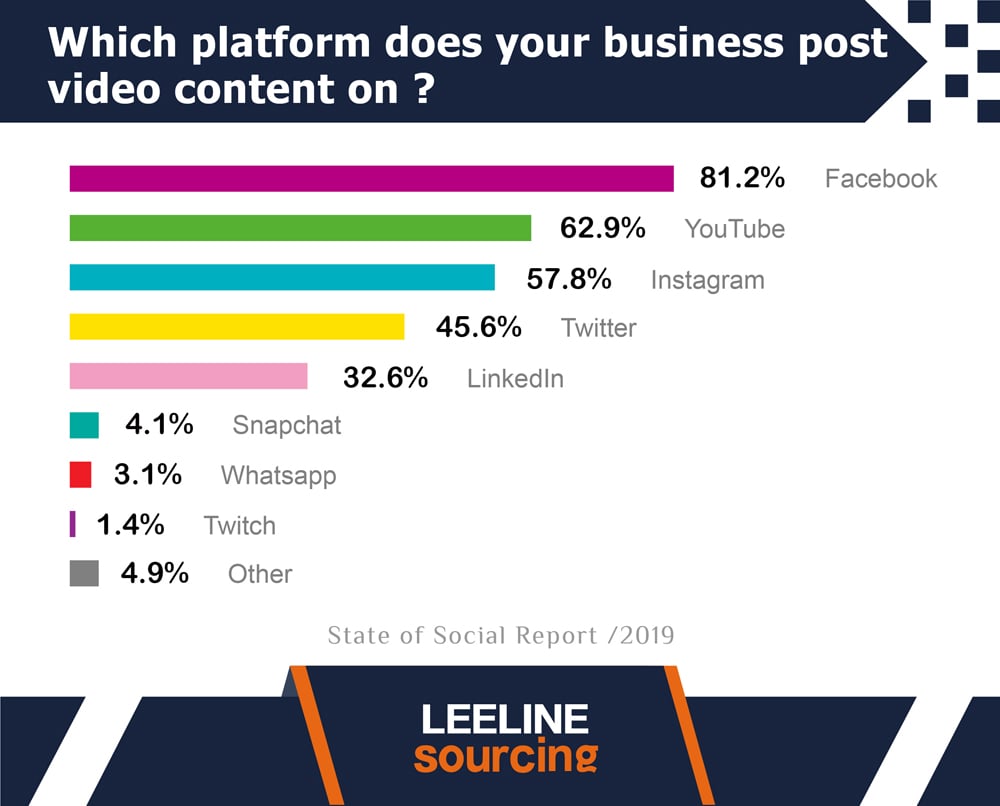
- 81.2% of businesses target FACEBOOK. They post videos and other FACEBOOK POSTS to engage people. It is the NUMBER#1 platform for businesses.
- Another social media platform is YOUTUBE. 62.9% of businesses post VIDEOS on Youtube. It is JUST AFTER THE FACEBOOK for the business opportunity.
- Instagram is a SOCIAL MEDIA PLATFORM owned by the META GROUP. It is THIRD on our list. 57.8% of businesses use it for VIDEOS. It creates MAXIMUM engagement.
- Twitter is the FORTH on the list. It has 45.6% of the business working on it. LinkedIn is the FIFTH on the number. 32.6% of companies choose it.
Facebook Ad Statistics
While browsing, I noticed Facebook ads.
There are OFTEN two types of Facebook ads that I noticed. It is just my personal EXPERIENCE.
- Video ads run before the video plays.
- Facebook SPONSORED ADS is often visible under the posts.
Look. These are not only FACEBOOK advertisements.
Instead, you have multiple other options. One thing is COMMON. Facebook ad impressions define the TOTAL COST paid by Facebook advertisers.
Do you want to know about Facebook advertising statistics?
Here are SOME FACEBOOK ADVERTISING STATISTICS you must know.
- There are AROUND 10 million advertisers on FACEBOOK. These Facebook advertising statistics belong to the USA ONLY. Every year, there is an EXPONENTIAL increase in the total number of advertisers.
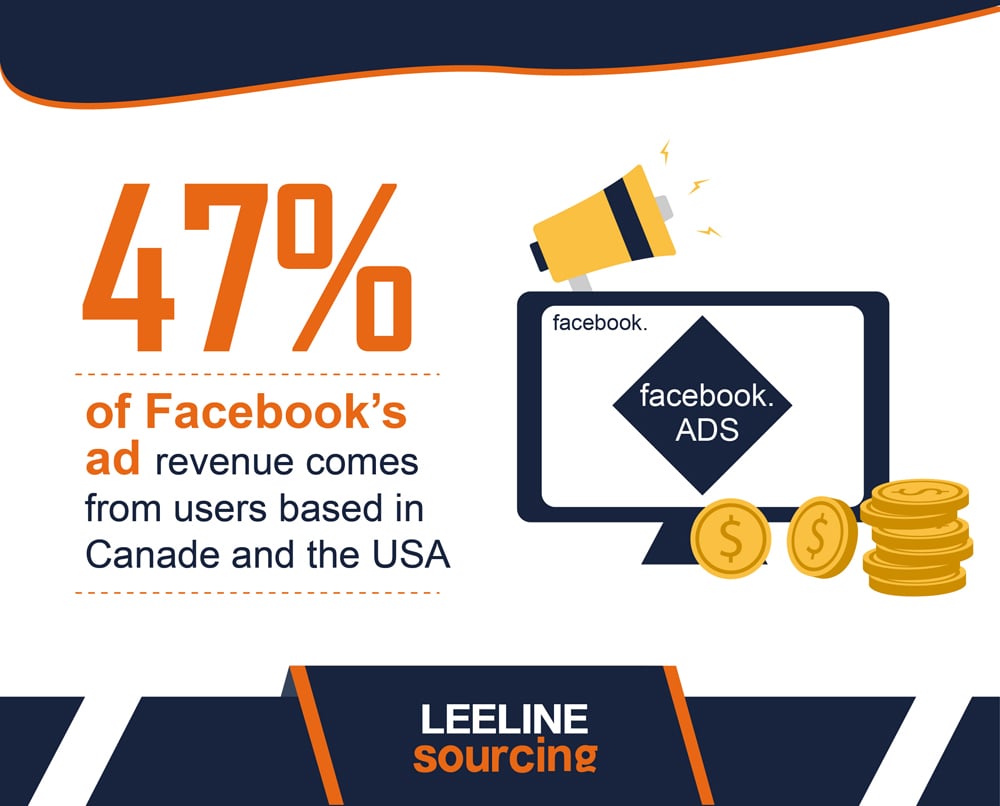
- 47% of the FACEBOOK ad revenue comes from the US and CANADA. In 2021, Facebook’s ad revenue was 13.3 BILLION USD just from USA and CANADA. Total Facebook ad revenue globally is 28 BILLION USD.
- Facebook advertising costs around 0.97 USD per click. Whether mobile ads or desktop, advertisers have to pay IMPRESSIONS.
- An AVERAGE click per FACEBOOK user is around 12 ads. It costs the price to the ADVERTISERS. Facebook users SPEND millions of dollars on FACEBOOK ADS.
Facebook Marketing Statistics
Facebook FAMILY is in BILLIONS. It is something that makes FACEBOOK a spicy TOOL for marketing.
Did you launch a BRAND? It is time to PROMOTE. If users SPEND 5 USD, they reach 2-3K people.
Not that is ONLY the scenario.
Influencer MARKETING is another thing. Page marketing through different FACEBOOK posts and group is also FEATURABLE.
So, here are the latest Facebook statistics on Marketing.
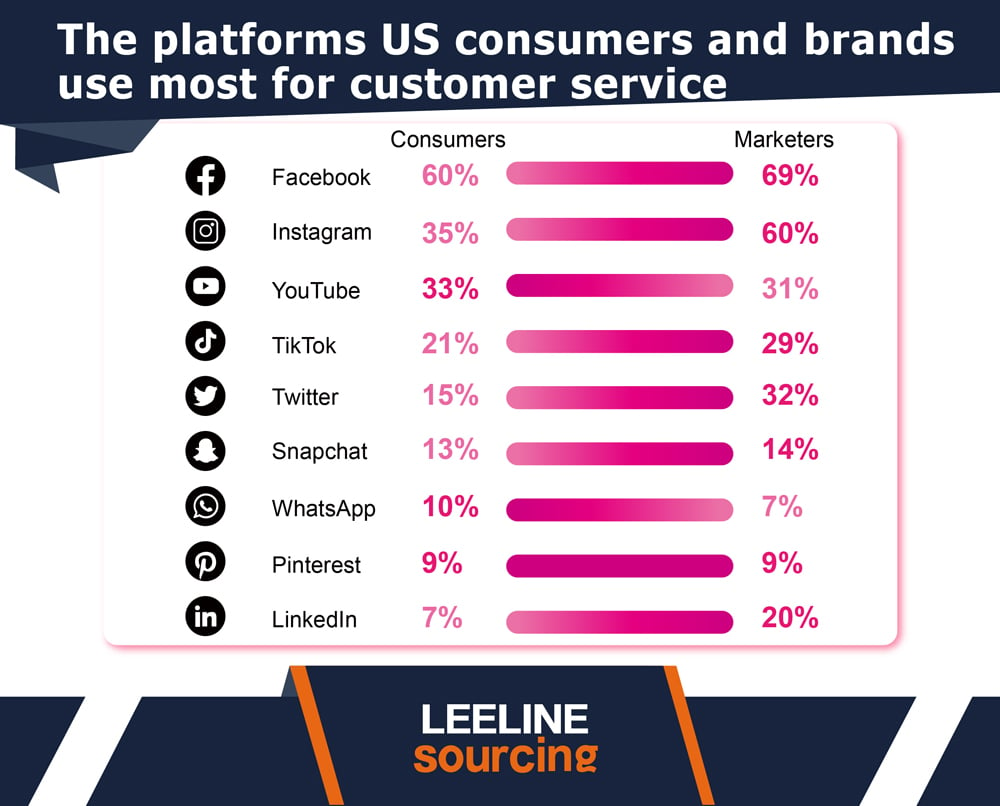
- 69% of MARKETERS use Facebook to market their products. The sole reason is the EASE to work with Facebook ads and marketing. That is why FACEBOOK tops the chart for marketing.
- 60% of MARKETERS used INSTAGRAM for the audience. This social media platform is JUST BEHIND FACEBOOK.
- The third rank is of the YOUTUBE. It has a share of 31% of the marketing.
- 90% of GLOBAL marketers use the FACEBOOK audience to promote their brands.
- 75% of the BRANDS pay bucks to promote their FACEBOOK POSTS.
- 59% of the MARKETERS agree on the FACT. Facebook is their FAVORITE social media platform.
- 38% of MARKETERS use Facebook Live as their MARKETING platform.
- 50% of marketers have scheduled to increase their activities. 10% of marketers don’t agree with this.
Facebook Messenger statistics
Whoever knows about FACEBOOK also knows the messenger app.
Whatever you MESSAGE on Facebook, one receives in the Facebook messenger app.
That means FACEBOOK with Messenger is a COMPLETE social app.
There are some statistics associated with the messenger also. These are:
- Around 1.3 BILLION PEOPLE use the MESSENGER. That means a MAJOR PORTION FACEBOOK MONTHLY ACTIVE USERS is on the messenger also.
- Around 100 BILLION MESSAGES are shared every single day through MESSENGER. It is a HUGE figure. An average of 13 messages per person is a BIG value.
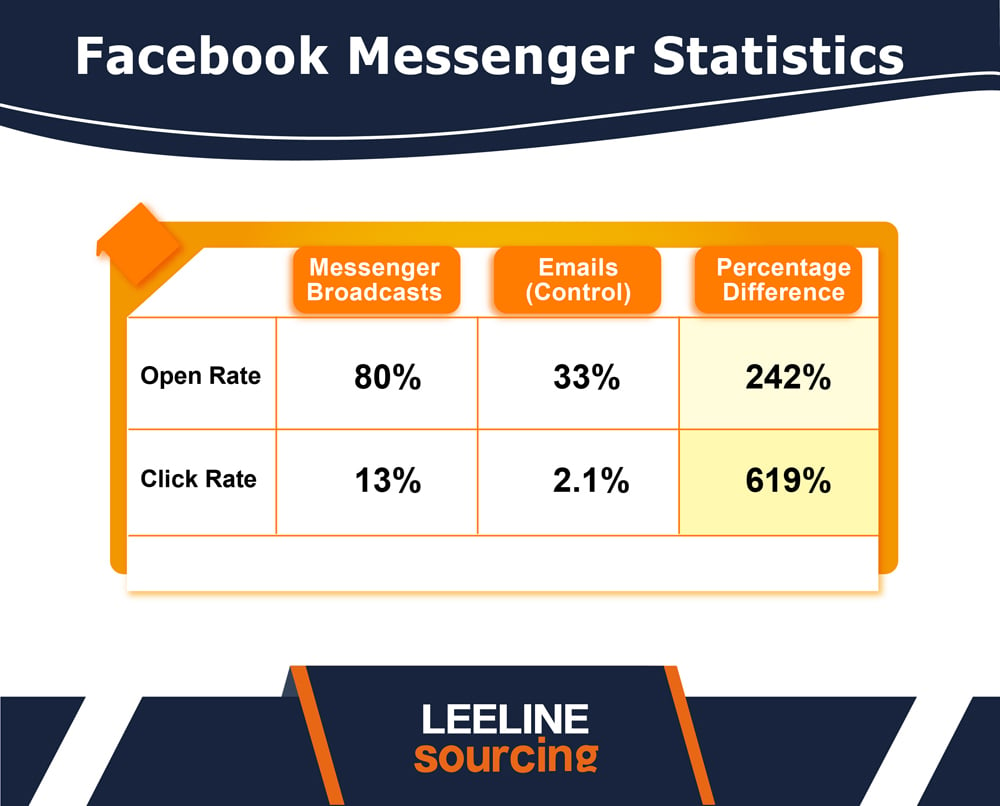
- There is a HUGE difference between email and messenger based on Open rate. Messenger has an OPEN RATE of 80%, while email has 33%. Can you Observe the HUGE DIFFERENCE?
- The click rate is also very MUCH DIFFERENT. For example, messenger messages have a CTR of 13%. At the same point, email has just 2.1%. Email CTR is nothing in front of the messenger CTR.
Average Time Spent on Facebook
I spend one HOUR at least daily on Facebook. What I do:
- Scroll my Facebook feed to know what others have SHARED.
- Watch videos if they take my ATTENTION.
- Look at the FACEBOOK ADVERTISING CAMPAIGNS.
- Zoom in on the images on the posts.
It becomes 30 HOURS PER MONTH.
Many Facebook users spend hours. Here are different stats.
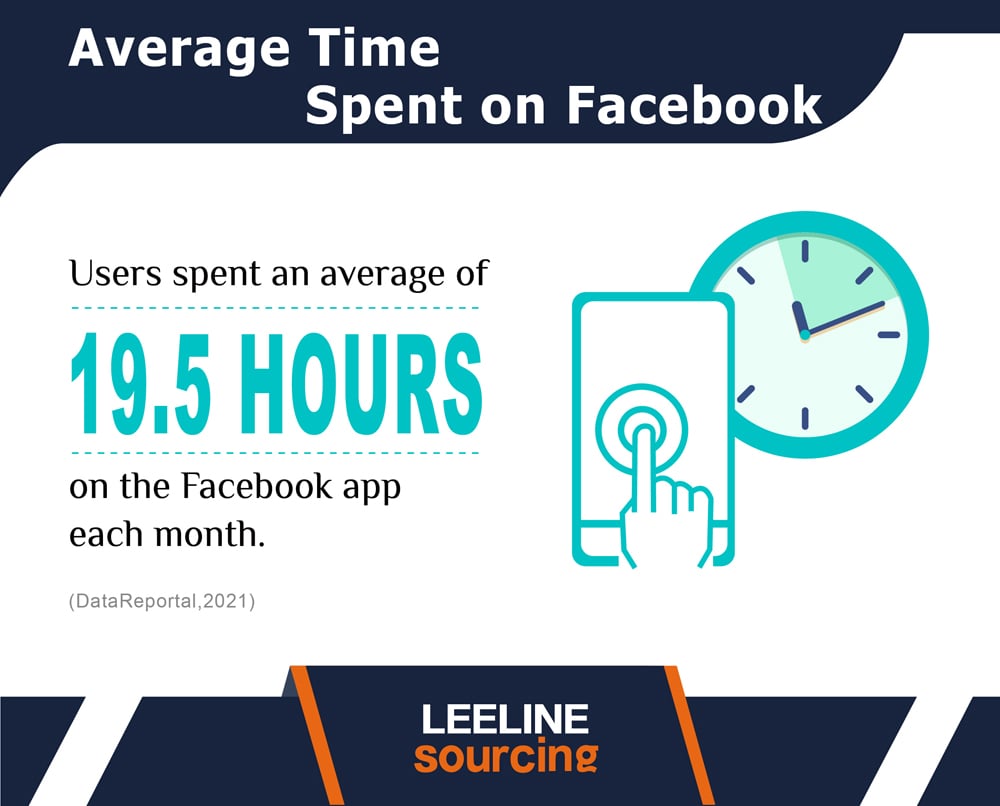
- Facebook remains the TOP SOCIAL SITE for time spent. The average time spent on Facebook is 19.5 hours per user per month. It might be FORTY HOURS per month for some users. Facebook generates MAXIMUM engagement through videos on Facebook pages and groups.
- Instagram is SECOND on the list with 10.4 hours per MONTH.
Discover Products through Facebook
What do you USE to find a product?
Social media platforms. If I specify, it will be the VIDEO platforms like TikTok.
Brands use FACEBOOK video ads and TikTok for Marketing. Sometimes, it is influencer marketing as well.
Here are some stats.
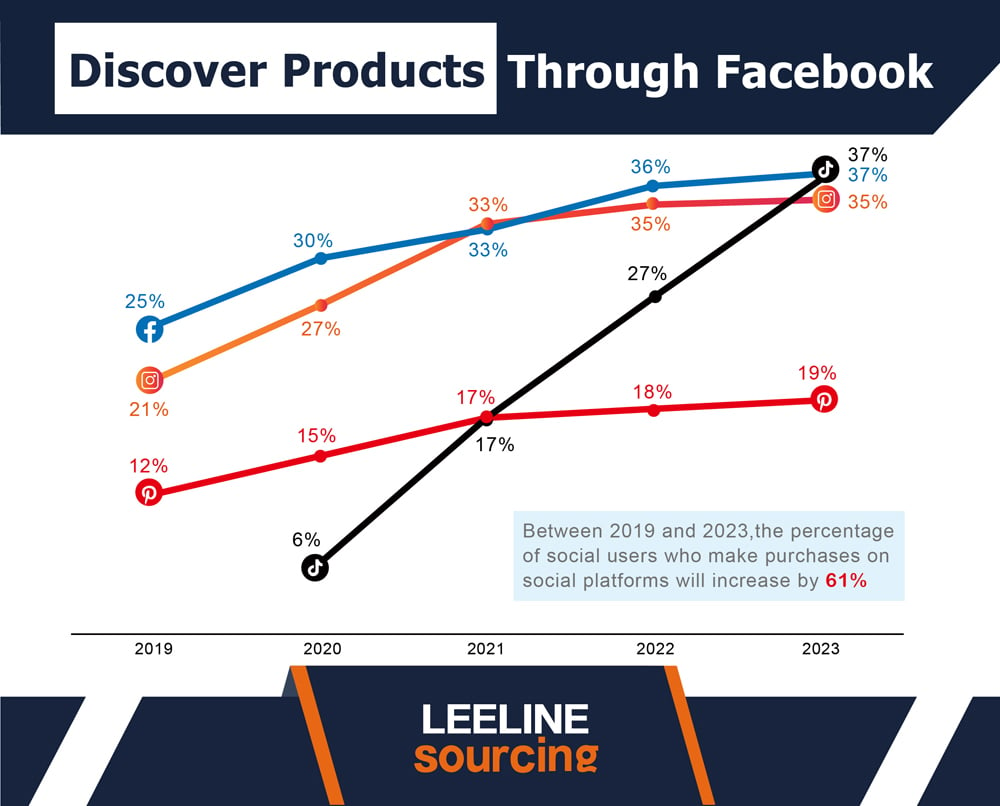
- In 2019, FACEBOOK led the chart. 25% of US buyers used it to find products. Instagram was second with 21%.
- In 2020, there was an INCREASE of 5%. A total of 30% of the USERS used Facebook to explore products.
- In 2021, it increased to 33%. And in 2022, 36% of US buyers purchased the products through FACEBOOK.
- In 2023, we have FACEBOOK on the TOP with 37% US BUYERS.
What’s Next
Facebook is SOON going to BLAST. A 3 BILLION user mark is not FAR AWAY.
If you are looking for MARKETING, it can be the BEST choice. The stats prove my point.
Need more stats?
Go through our WEBSITE. You’ll get different stats on social sites.