Businesses rely on CONVERSION RATES. And why is it so?
Whenever a customer visits the website, they click on the products. And if the customer purchases products, the seller receives a conversion for a click. Conversion is HIGH—and more sales occur.
And I guess every seller wants to MAKE higher sales. And bring more revenue. Isn’t it so?
95% of sellers have a TARGET conversion rate. They optimize the PRODUCTS and run marketing campaigns.
The result is the HIGHER conversion with more sales.
Interested in learning more about the Conversion rate Optimization rate statistics? This article deep dives into the topic.
Let’s know more!

- What is conversion rate optimization?
- General conversion rate optimization statistics
- Conversion rate optimization adoption Statistics
- Conversion rate optimization challenge Statistics
- Landing page optimization statistics
- Conversion rate optimization strategies
- Conversion rate testing statistics
- E-commerce conversion rate statistics
- Digital marketing conversion rate statistics
- Website conversion rate statistics
- Advertising channel conversion rate statistics
- SEO conversion rate statistics
- Blogs conversion rate statistics
- Social media conversion rate statistics
- Email conversion rate statistics
- What’s Next
What is conversion rate optimization?
Conversion rates are the sales per click.
For example:
Suppose ten paying customers VISIT your FALSE eyelashes. Five of them buy the FALSE EYELASHES. You have CONVERSION rates of 50%.
More conversion rates mean MORE SALES. And conversion rate optimization is the implementation of techniques to increase conversion.
Isn’t it simple?
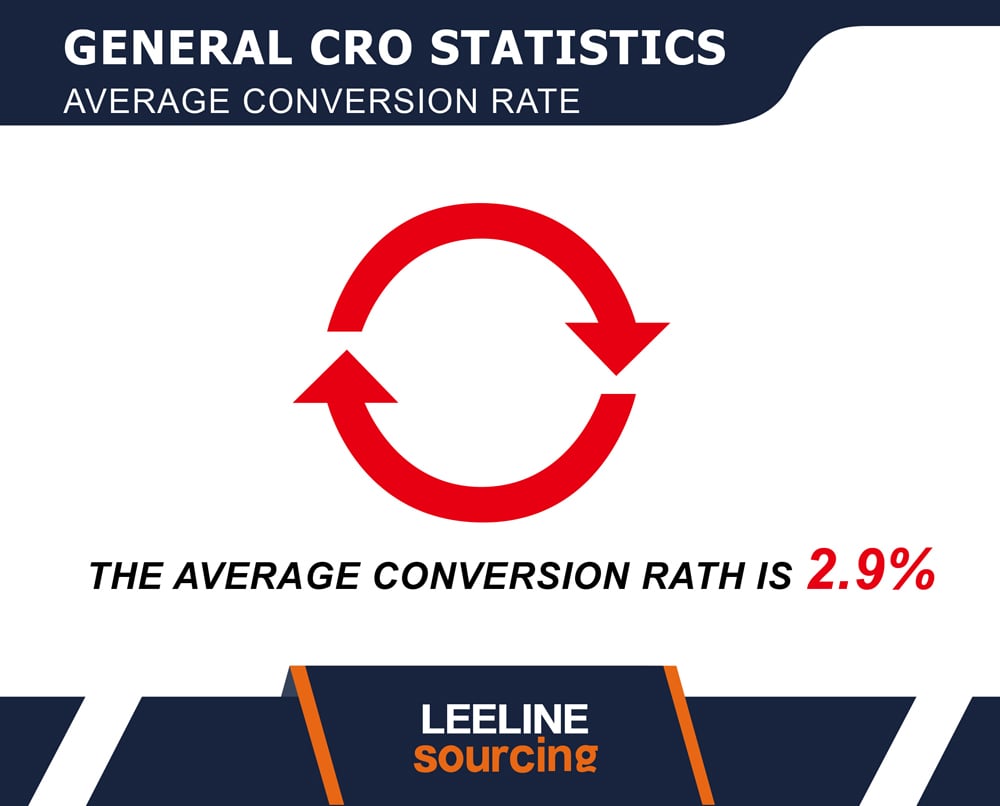
General conversion rate optimization statistics
Conversion is the SIMPLEST parameter for businesses to measure progress. Higher conversions bring MORE SALES and higher revenues.
Whenever a BUSINESS has to check the growth, they test conversion rates. It shows how THEIR PRODUCTS or brands are PERFORMING in real-time.
And businesses invest in MORE website traffic for more conversion. Marketing campaigns are the MAIN TARGET to increase conversions.
I have GOT some key statistics related to the conversion rate.
- The average conversion rate AMONG all the industries of 2.9%. The data was collected from a MILLION data points. Later, the report showed an AVERAGE conversion rate.
- The HIGHEST conversion rate is for the PROFESSIONAL services. Different services have an AVERAGE conversion rate of 4.6%.
- Just behind the professionals, the industrial zone LEADS the chart. It has an AVERAGE conversion rate of 4%.
- On the THIRD number, there is an AUTO industry. It includes all the AUTOMOBILES. The average conversion rate is 3.7%.
- On the FOURTH rank, you can find the legal industry. It has a QUITE high conversion rate of 3.4%.
- On the Fifth number, you can find two DIFFERENT industries. One is the dental and cosmetic industry. The second is finance. Both share an AVERAGE conversion rate of 3.1%.
First, I mentioned the HIGHEST conversion rate.
Now,
Four industries on the LOWEST rank for conversion rates. Want to know? Check them out.
- B2B trades have THE LOWEST conversion. Guess what it will be? It is around 1.8%. The reason can be the BULK products as per business size.
- The B2C industry is the SECOND-LOWEST. The average conversion rate is 2.1%.
- The average conversion rate for the B2B tech and agency is EQUAL. And they both share the THIRD-LOWEST rank. The conversion rates are 2.3% for both industries.
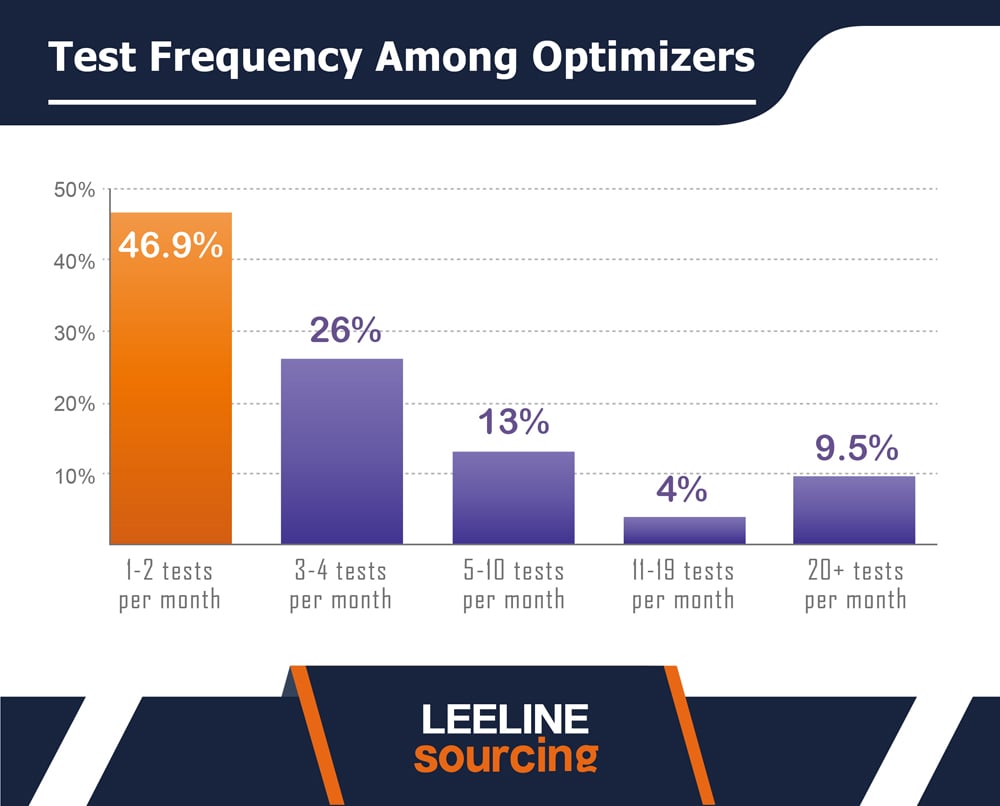
Conversion rate optimization adoption Statistics
Every business wants to boost CONVERSIONS. That is why they perform different tests.
These TESTS ensure the RIGHT PROGRESS of lead conversion on SITE VISITORS.
Here are some stats about the FREQUENCY for testing.
- 46.9% of the OPTIMIZERS perform 1-2 tests per month. It is the HIGHEST in this category.
- The second number is the 3-4 TESTS per month. Around 26% of the optimizers do that.
- 13% of the optimizers perform 5-10 tests per month.
- 4% of the optimizers perform 11-19 tests per month on PRODUCT conversion.
- 9.5% of the Optimizers execute 20+ tests to get a CONVERSION GOAL.
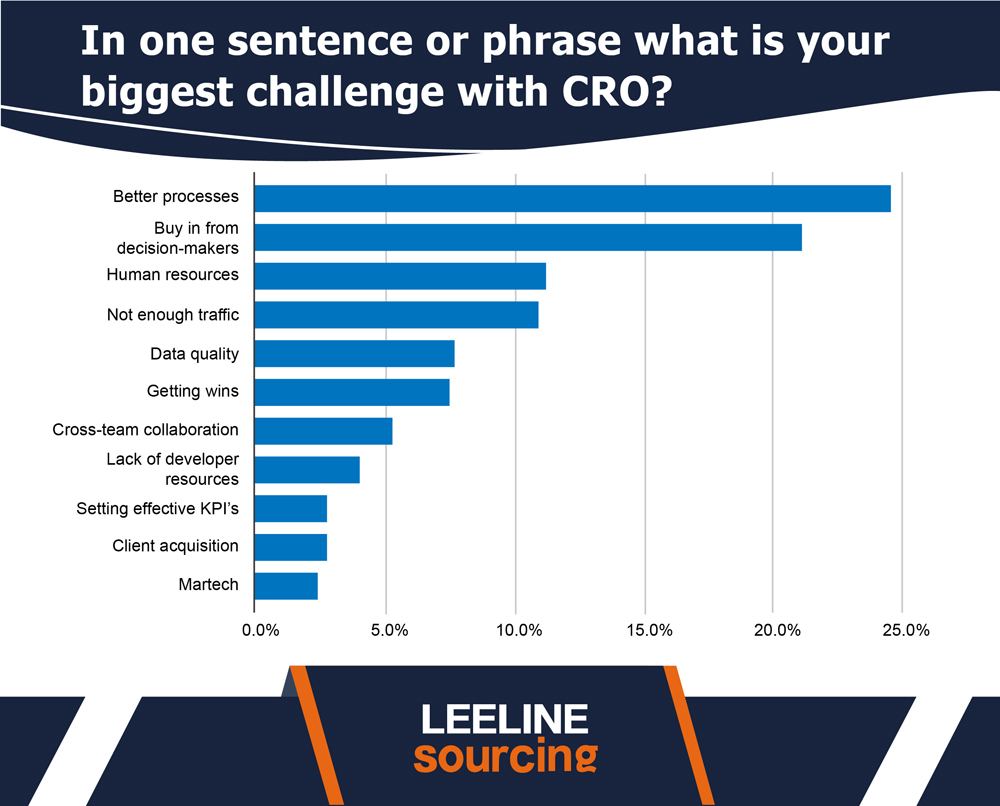
Conversion rate optimization challenge Statistics
CRO is not that EASY. It faces MANY CHALLENGES when starting the deal.
For example, you should apply a PREFERRED CRO METHOD.
Have that? Not? You’ll potentially fail.
Conversion rate optimization tools play a KEY role.
Let’s know different stats.
- Better processes are the BIGGEST challenge. Around 24% of businesses face it. (Source= CXL)
- Decision makers are ANOTHER big deal. 21% of the optimizers agree to it.
- Human resources are also a BIG DEAL. 12% of the optimizers agree with this fact.
- Traffic for e-commerce websites is a BIG problem. Sometimes less traffic drives very low conversions.
- Data Quality or client acquisition contributes to other PROBLEMS.
Landing page optimization statistics
Long-form landing PAGES are critical features of a website. Landing pages are the web pages where customers convert.
For example, a service page. And a business targets the OPTIMIZATION from this.
The reason?
First impressions must IMPRESS your customers. And landing pages create that first impression.
Here are detailed statistics about the LANDING PAGE optimization.
- 48% of the MARKETERS rely on a landing page. 50% of the TRADERS focus on a new landing page. The aim is to provide an EXCELLENT experience to the customers.
- 87% of businesses use the VIDEO CONTENT on a landing page. 86% increase in CONVERSION rates is possible through the OPTIMIZED landing pages.
- Different STATS show the impact of landing pages. As per the report, 10 to 15 landing pages can generate LEADS by 55%.
- Website navigation is a CRUCIAL PART. Removing navigation has PROVEN conversion rates of 100%.
- Marketing specialists create 40+ landing pages. It increases the LEADS by 1200%.
- On landing pages, buttons play a KEY ROLE. A CTA button reduces the conversion rates by 3%. On the other hand, the Click Here button increases the CONVERSION rates by 30%.
- 62% of the B2B sellers have six or fewer LANDING pages. It can affect their SALES and reduce their revenue.
- Longer LANDING PAGES are more effective short-form landing pages. As per the survey, they generate 220% more leads.
- Marketing automation through a LANDING PAGE can increase leads. There has been an INCREASE of 451 percent.
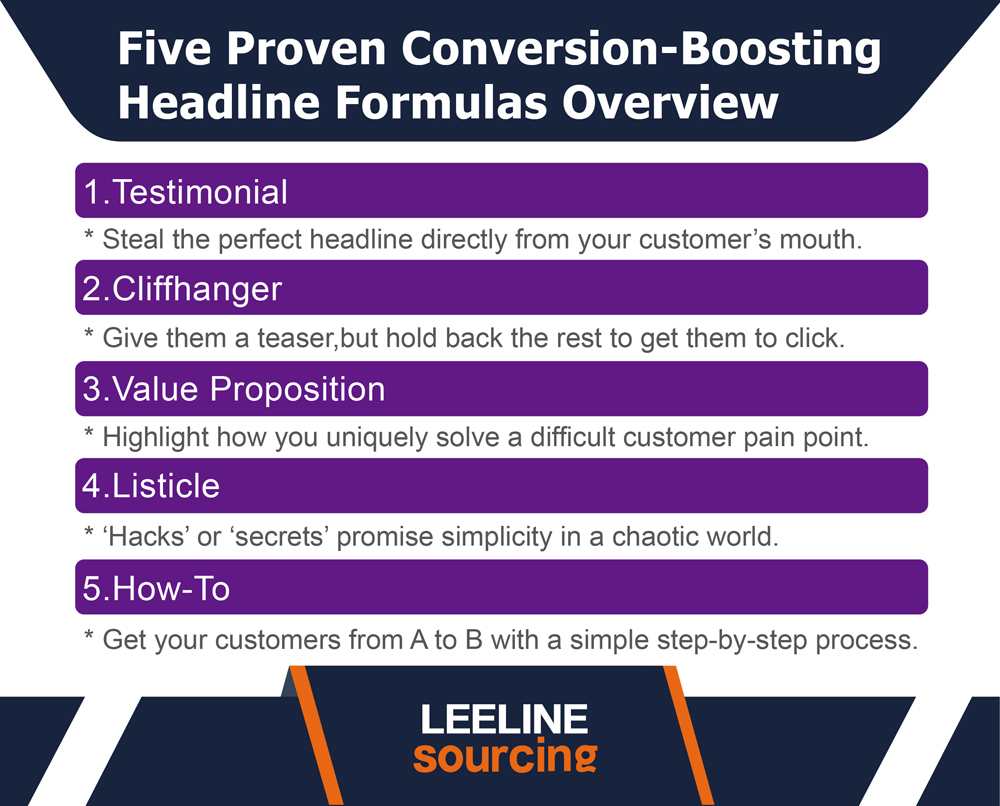
Here is the PROVEN formula for landing pages.
- Testimonials. Use the PERFECT headline that the customer needs.
- Cliffhanger. Just make your customers CURIOUS about the upcoming products.
- Value Proposition. Shows customers how you resolve their ISSUES instantly.
- Listicle. Hacks and SECRETS promise better conversion rates.
- How to: Resolve customers’ issues with a step-by-step guide on anything.
Conversion rate optimization strategies
How many BUSINESSES make the optimization strategy? Whether it is a SEARCH engine optimization or CRO, there are different stats.
Most brands TRY to get MORE out of their marketing automation campaigns. They SPECIFY a budget for paid search.
But not all have that. Here are some stats related to IMPROVING conversions.
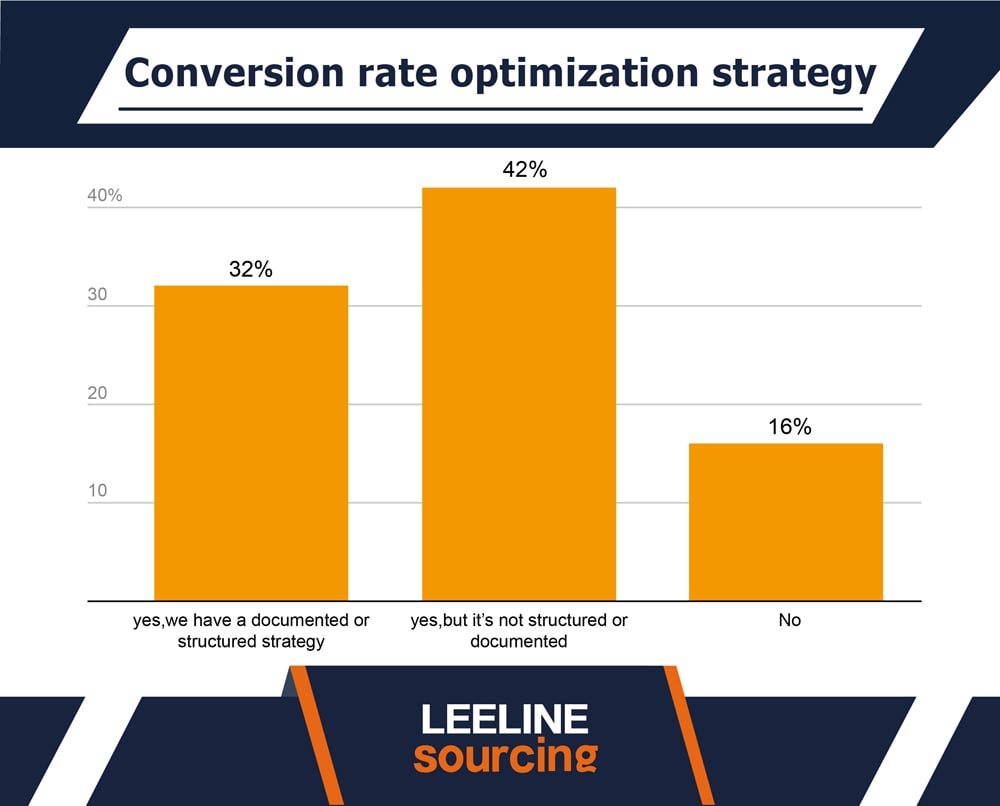
- 32% of businesses say they have a STRATEGY to improve conversions. Their strategy is STRUCTURED and documented.
- 42% say they make a STRATEGY. But don’t make it STRUCTURED or documented.
- 16% of marketers don’t have CRO STRATEGIES to improve conversions. It can be a BIG problem for customer acquisition.
Conversion rate testing statistics
Many marketers are using the CONVERSION rate optimization tools. CRO tools increase conversions. Split testing, A/B testing, or Customer Journey Analysis to increase conversions.
Let’s know some stats.
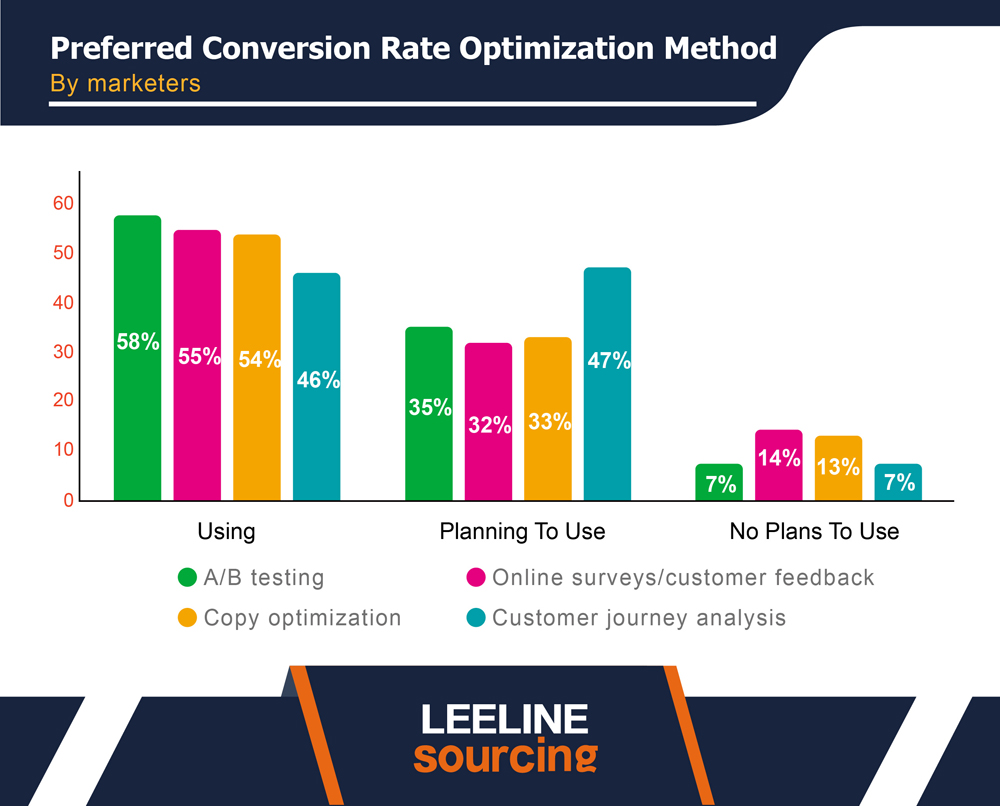
- 58% of MARKETERS are using A/B testing. 55% use online surveys. 54% consider the COPY optimization. And 46% of marketers analyze customer journeys. (Source= Econsultancy)
- 35% of marketers are PLANNING to use A/B testing. 32% are planning online surveys. 35% are planning to focus on Copy optimization. And 47% plan to analyze the customer journey.
- 7% of marketers don’t want to use the A/B testing. 14% are not CONSIDERING the online surveys. 13% don’t consider copy optimization. And 7% don’t analyze customer journeys.
E-commerce conversion rate statistics
The eCommerce industry is VERY BIG. You have multiple parent niches. In the big niches, you can find many SUB-NICHE.
That makes hundreds of niches to sell. And guess what niche will have the HIGHEST AVERAGE conversion rate?
I have listed some statistics showing the average website conversion rate.
- For the eCommerce industry, the average conversion rate is 2.7%. It varies among the different niches.
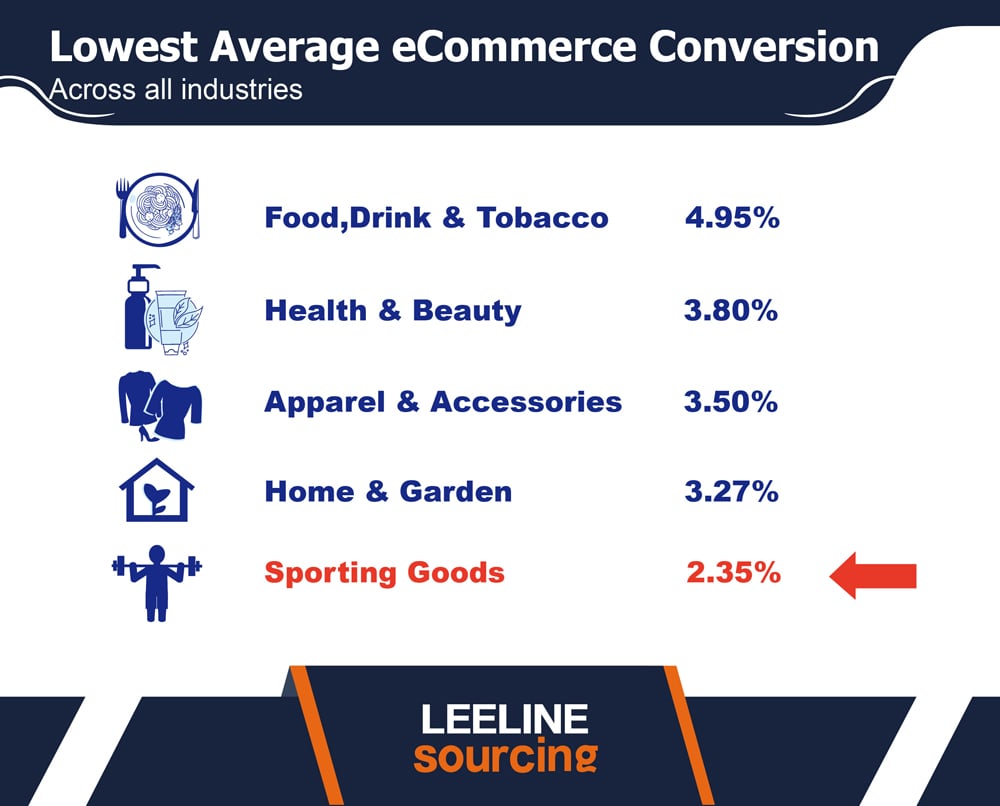
- Food, drink, and Tobacco niche is on the TOP. It converts Website visitors into sales. The average rate is 4.95%.
- Health and BEAUTY come on the SECOND rank in the eCommerce industry. It has a conversion of 3.80%. That means 3.80 percent of its website visitors purchase the PRODUCTS.
- The third rank is in the Apparel and Accessories industry. It has a CONVERSION of 3.50%.
- Home and Garden comes next to the Apparel industry. It has a DECENT conversion of 3.27%.
- The FIFTH number is the sporting Goods. The site’s conversion rate is 2.35% of the customers.
- The lowest CONVERSION is of the jewelry and luxury industry. In the eCommerce industry, they have a rate of only 1.5%.
Digital marketing conversion rate statistics
To increase sales, there is a NEED for increased conversions. Marketing optimizes the conversion.
SMB marketers have a TOTAL marketing budget.
Most marketers use it to get WEB TRAFFIC on a desired web page. Many marketers have given some REVIEWS. You can check the RELEVANT statistics.
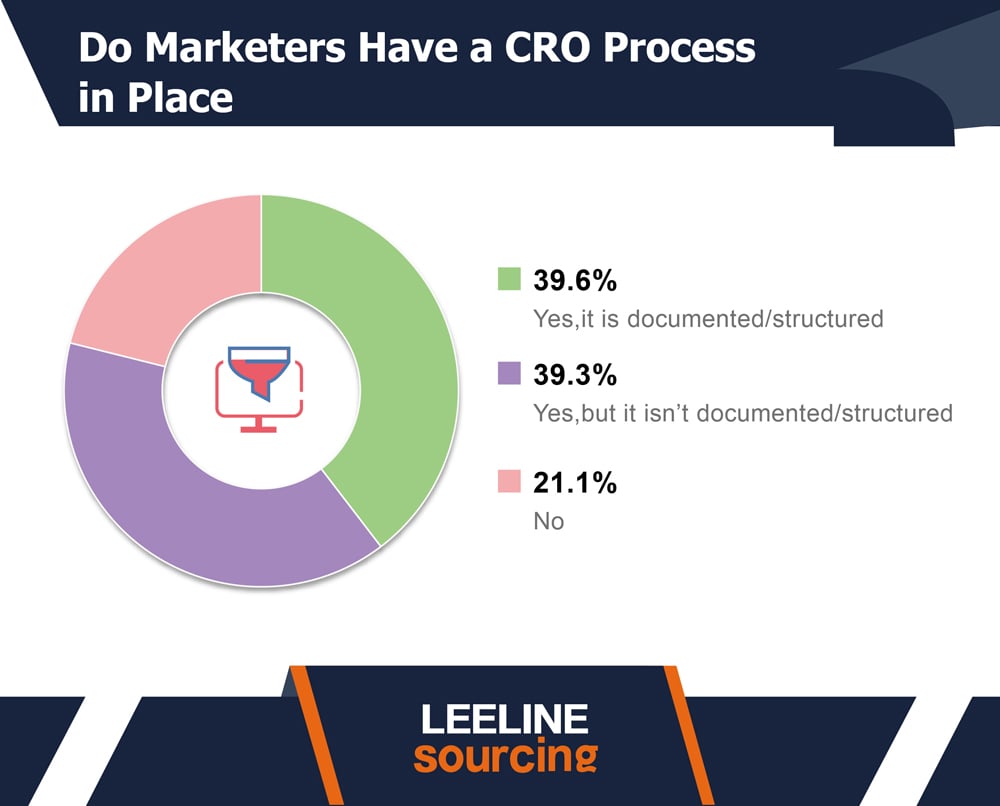
- 39.6% of the MARKETERS have a CRO process. It is already documented and structured with ready-made STRATEGY.
- 39.3% have a MARKETING strategy. But the strategy is not DOCUMENTED or structured.
- 21.1% say no to the CRO process in digital marketing.
- Five minutes of DESIRED action increase the SEARCH CONVERTS. There are nine FOLD more leads for e-commerce sites.
- 67% of the customers interact with mobile-friendly businesses better than others. 46% of sales are MOST probably to occur on a MOBILE device compared to a desktop.
- Content MARKETING drives 6X more results than other types of MARKETING.
Website conversion rate statistics
A web page provides the OPPORTUNITY for better interaction. That is why all bigger businesses have websites.
But a website provides USER-targeted content. And more conversions happen with the THEMES and website’s functionality.
Here are some points of the BEST PERFORMING WEBSITES.
- They have excellent product pages driving sales.
- User behavior and EXPERIENCE are at the top.
- Website copy procures the QUALITY.
Here are more conversions.
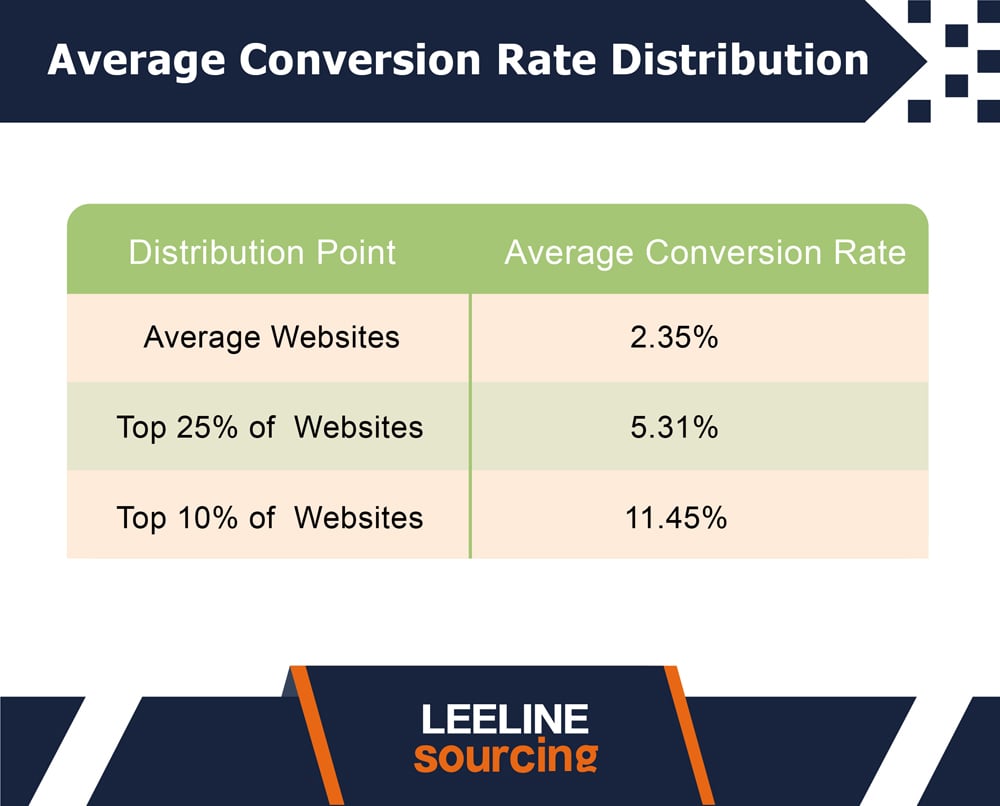
- The average conversion of a WEBSITE is 2.35%.
- The top 25% of the websites have a CONVERSION of 5.31%.
- The top 10% of the WEBSITES have 11.45%.
- Most websites drive conversions with the DESKTOP experience. Around 3% of the leads generated are through the DESKTOP users. Mobile users make up 2% of the CONVERSIONS.
- Organic SEARCH has more conversions. Around 14.6% of conversion is through organic traffic.
- Paid search has CONVERSIONS of 1.7% only.
Advertising channel conversion rate statistics
The Significant Investment for most companies is in advertisements.
And there are MANY CHANNELS for advertising campaigns. For example, Google Adwords offers Google Ads.
Such ads APPEAR in a blog post or shopping page. Increasing landing PAGE conversions is the goal.
Let’s check out the statistical data.
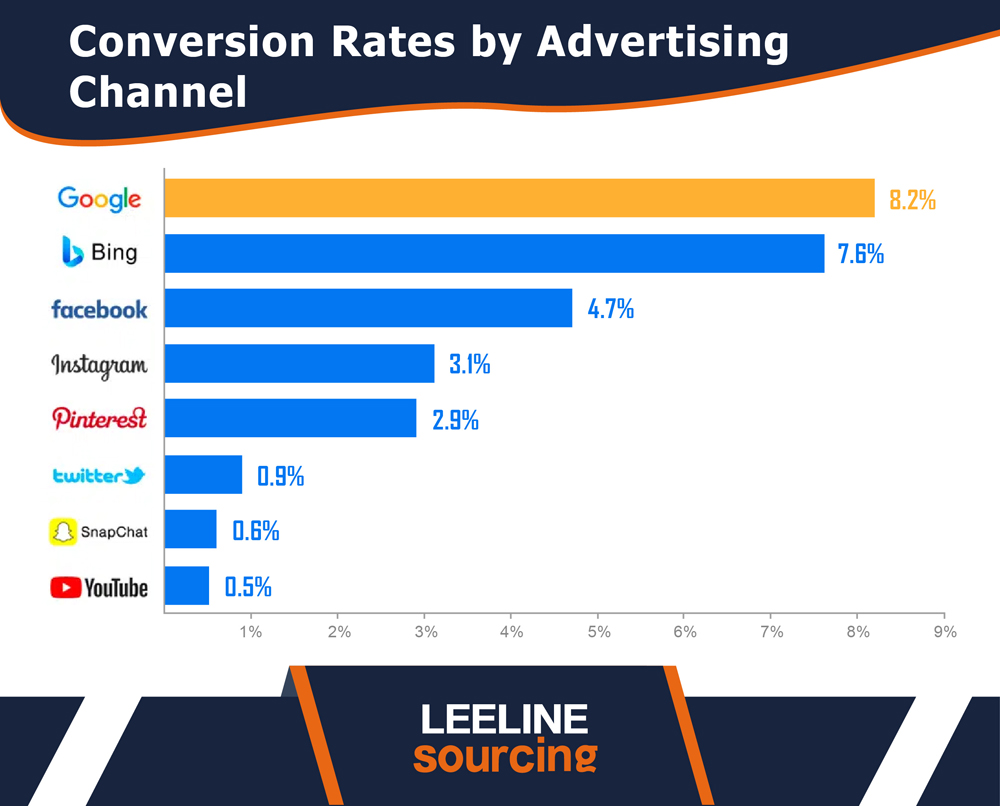
- Google is the most COMPELLING advertising channel. It has an AVERAGE conversion of 8.2%.
- Bing is the second most POPULAR conversion rate optimization software for LEADS. It has an average conversion of 7.6%.
- Facebook comes third with the conversions. It has a RANGE of conversion with a 4.7% rate.
- Instagram is FOURTH on our list. It has an AVERAGE conversion of 3.1%.
- Pinterest is JUST AFTER Instagram. It has a RATE of 2.9%.
- Twitter generates 0.9% CONVERSION for user-generated content.
- Snapchat comes after Twitter for mobile devices or desktops. It has a 0.6% conversion.
- Youtube is one of the TOP CRO tools. It has a conversion of 0.5%.
SEO conversion rate statistics
Everyone FOCUSES the search results. Do you know why? Because it helps reduce the bounce rate. You OPTIMIZE existing traffic and get more qualified leads. USER-GENERATED content has a proven record.
I have listed some critical stats related to SEO.
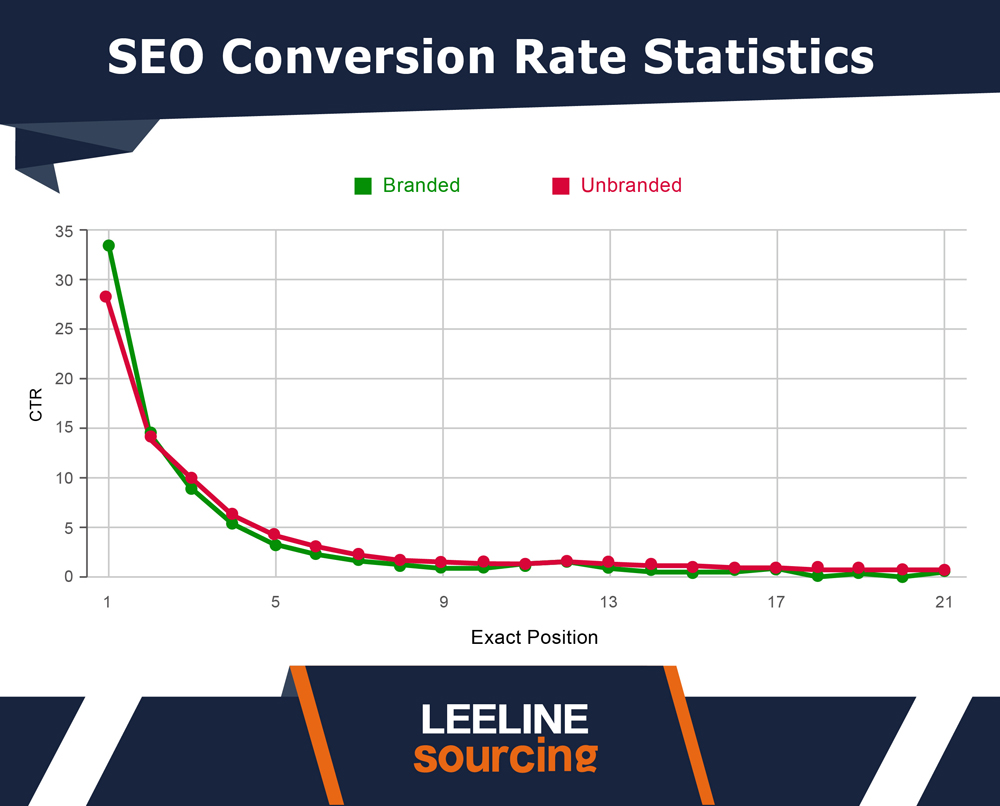
- Number 1 RANKING increases the CTR to 30%. If your website SLIPS to rank 2 or 3, your CTR decreases to 10%. Once you are out of the top 9 POSITIONS, CTR falls to 2% or below.
- SEO increases ORGANIC traffic. The ORGANIC USERS generate 94% of the QUALIFIED LEADS.
- Organic leads have a CONVERSION of 14.6%. On the contrary, outbound leads have a CONVERSION of 1.7%.
- Organic conversion varies in different INDUSTRIES. 20% conversion is in the consultancy and marketing agency. Media and publications have a 20% conversion. Retail and wholesale distribution has an 11% conversion.
Blogs conversion rate statistics
Blogs can SERVE multiple purposes. For example, bloggers use it to generate INCOME. While brands such as Nike aim at DRIVING brand awareness and sales.
Now the question is, when should you PUBLISH a blog?
It depends on the PURPOSE. Here are different stats related to the purpose.
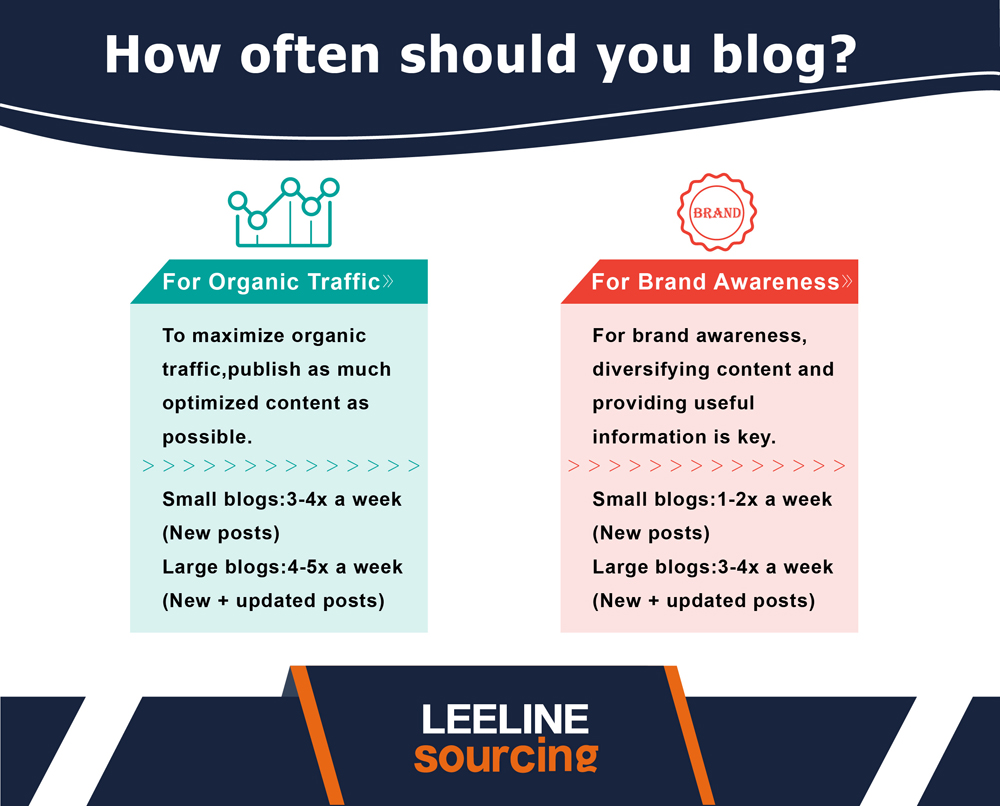
For organic Traffic
The more the BLOGS are there, the maximum probability will be.
Therefore, you can get REFERRAL traffic or organic through blogs. Here is how you should act.
- Small blogs PUBLISH 3-4X blog posts. You should publish New posts.
- Large blogs publish 4-5X blog posts. There can be NEW or UPDATED posts.
For Brand Awareness
For brand awareness, the AIM is to publish and get more PEOPLE known.
And blogs can HELP the brands. Here is how you should act in this case.
- Small blogs should publish 1-2 new blog posts.
- Large blogs should publish 3-4 posts a WEEK. It can be a new or updated post.
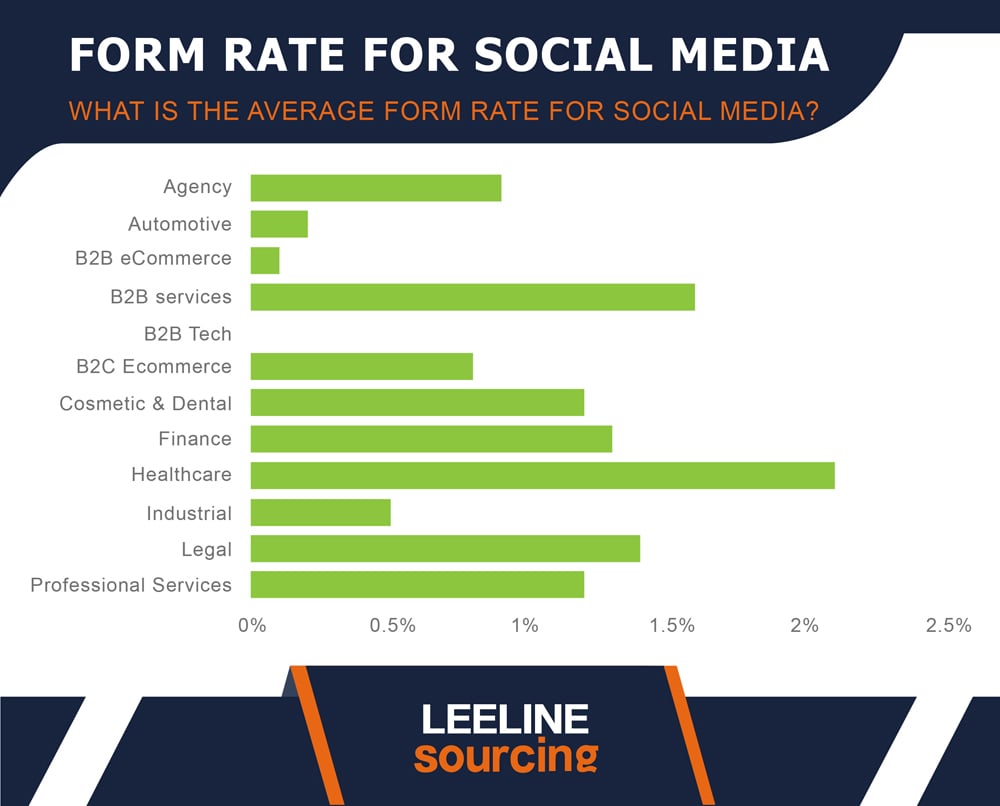
Social media conversion rate statistics
Social media is a MEDIUM for various business aspects. Marketers use influencer marketing. Sell their products. And generate more income.
But how MUCH can you convert your clicks?
I have listed the conversion rate for the social media ads.
- The HEALTHCARE industry has a conversion of 2.4% on social media. It is the MAXIMUM rate for any industry on social media.
- B2B services are second on the LIST. It has got a conversion of 1.8% on social media.
- The legal Industry has the third rank regarding CONVERSION. On social media, it has a CONVERSION of 1.5%.
- Finance is FOURTH on the list. It has a conversion of 1.3%. That means out of clicks, 1.2 people purchase the products.
- Professional services are FIFTH on the list. It has got a conversion of 1.2%.
- B2B eCommerce has the LEAST CONVERSION rate on social networks. It has a rate of 0.2%.
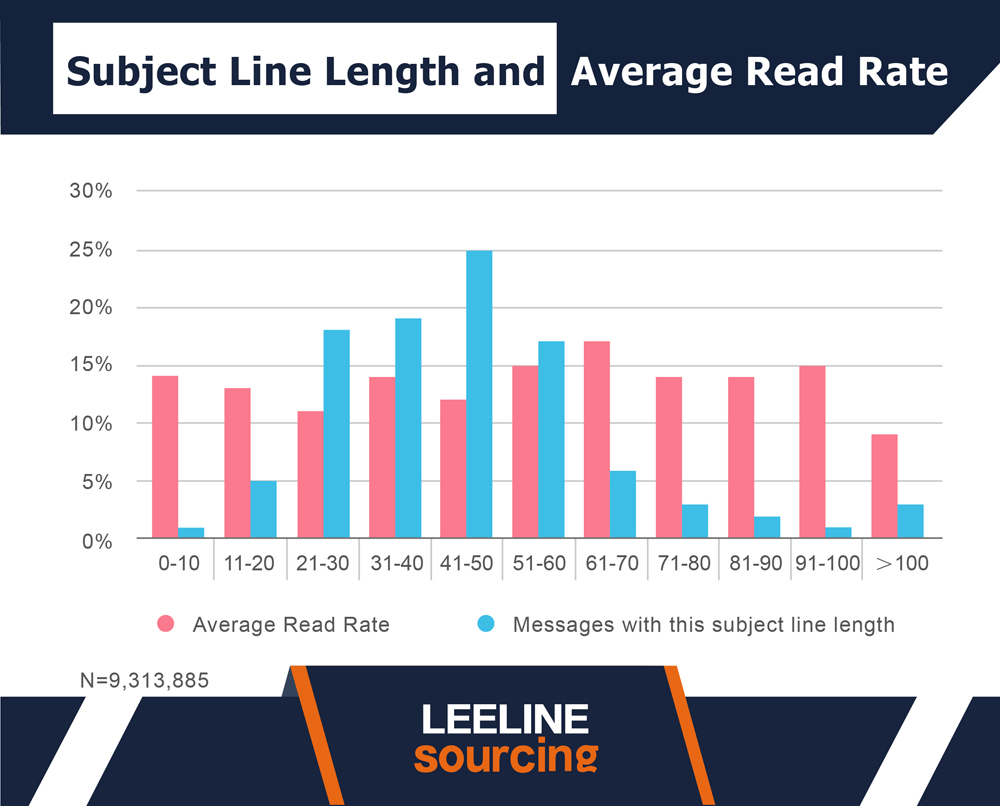
Email conversion rate statistics
Do you write emails for MARKETING?
Let me tell you ONE FACT. Email marketing has a QUITE HIGH conversion rate.
Therefore, marketers use it. In email marketing, EMAIL COPY is a crucial factor in generating sales.
- How long should your email be?
- What should be your format?
What length of emails generates maximum sales? Do you want to know that?
Here are some stats.
- The 41-50 characters are the MOST POPULAR. 25% of marketers use this length range. The average reader is 11% of such types of emails.
- The maximum reading is in the LENGTH of 61-70 characters. The reading percentage is 16%.
- The least number of marketers use emails with a length of 0-10 characters. Around 1% of marketers use it. The conversion rate is 14% for such emails.
- When characters exceed 100, the reading percentage is 9%. It is the least in any length.
What’s Next
Conversion rate is KEY to any business. Whether you are selling online products or providing services, it is CRUCIAL to know.
Interested in more stats like that?
READ more articles in our blog to know the LATEST and most accurate statistical data.