The TOTAL population of the world is 8 billion. And guess how MANY will be the CELL PHONE USERS.
I am sure all your GUESSES will be wrong. There are around 6.92 billion MOBILE users across the GLOBE. It is about 86% of the TOTAL population. Can you believe it? Such astonishing FIGURES!
More than half population has the DESKTOP.
No doubt, in Mobile vs. Desktop, mobile is the WINNER. It is because of portability and accessibility with excellent MOBILE EXPERIENCES.
Want to know some MORE EXCITING statistics?
Great!
This article will discuss A to Z statistics on mobile users with desktop users.
Let’s know!
- What Percentage of Internet Traffic Is Mobile?
- Mobile vs Desktop Traffic
- Mobile versus Desktop Internet Usage
- Time Users Spend on Mobile and Desktop
- Pros and Cons of Mobile and Desktop
- Mobile Usage Statistics
- Mobile App User Statistics
- Mobile Social Media Statistics
- Mobile Marketing Statistics
- Mobile E-commerce Statistics
- What’s Next
What Percentage of Internet Traffic Is Mobile?
Are you a mobile user?
I am. Even 99.9% are SMARTPHONE users. But internet users are DIVIDED into categories.
- Mobile users
- Desktop users
Guess what the MAIN SOURCE of traffic for websites is?
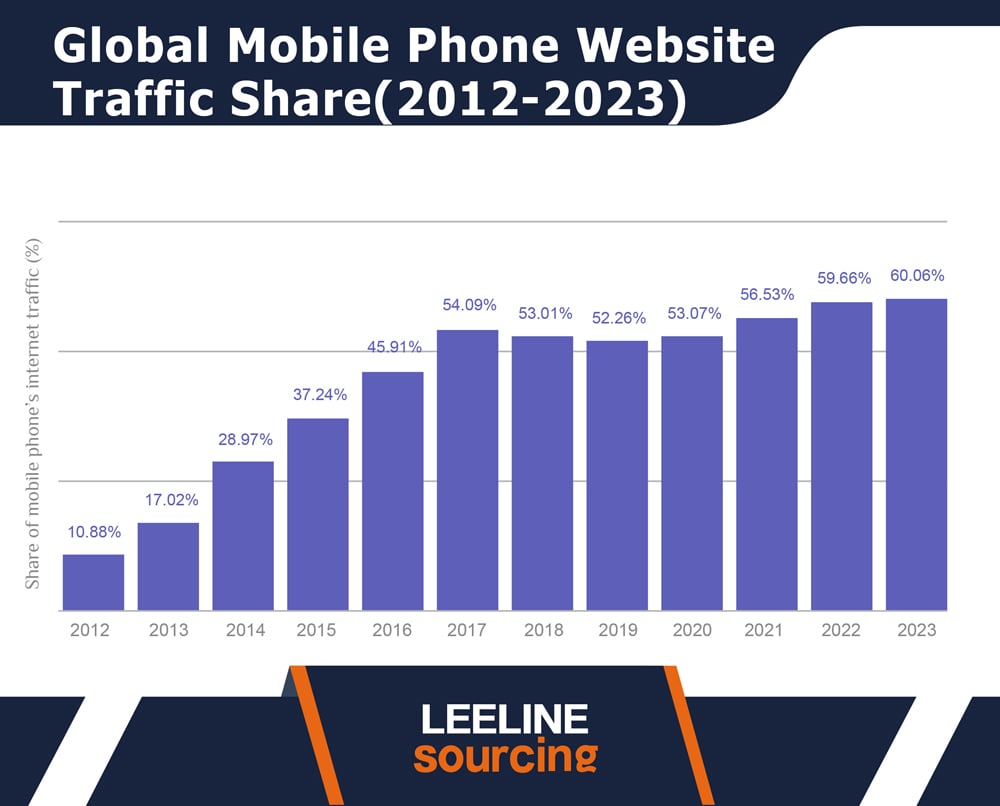
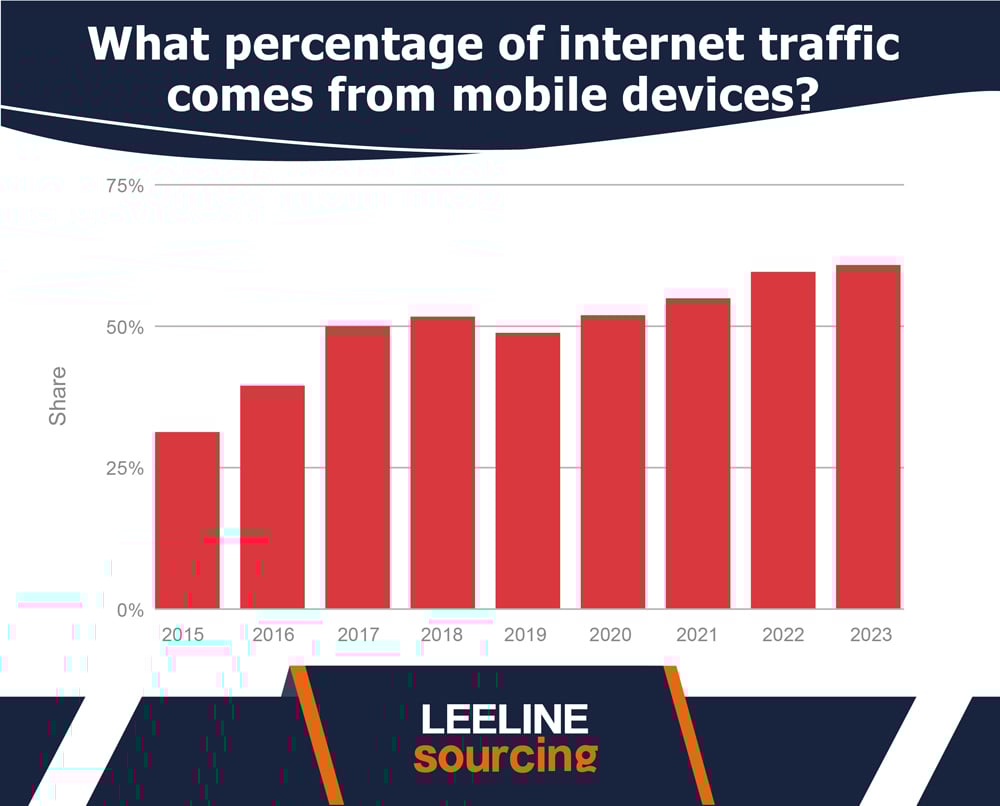
It is a MOBILE DEVICE. But before 2015, there was no such case. A report from Statista indicates the CHANGES in website traffic over some time.
- In the FIRST QUARTER of 2015, mobile devices had a CONTRIBUTION of 31.16%. The reason is the LESS ABUNDANCE of mobile devices among mobile users.
- In 2016, it rose to 39.47%. Not a BIG CHANGE, but it contributed a lot to mobile phones.
- In 2017, there was a SIGNIFICANT change in the total traffic. Mobile phones contributed around 50.03% of the TOTAL TRAFFIC.
- In 2018, Mobile phones rose a LITTLE bit. The total usage for internet users was around 51.77%.
- In 2019, there was a SLIGHT DECREASE in mobile traffic. The mobile phones contribution decreased to 48.71%.
- In 2020, mobile phones shared 51.92% of the OVERALL traffic.
- In 2021, the traffic was STEADY or even static to some extent. It raised with a CONTRIBUTION of 54.8%.
- In the first Quarter of 2022, mobile phones made a share of 59.66%.
- In 2023, REPORTS showed an increase of 1.23%. The total contribution was around 60.89%.
Mobile vs Desktop Traffic
There are MULTIPLE types of devices. You can’t say mobile devices are USED for the internet.
Apart from mobile and desktop devices, we have TABLETS. Tablet usage is not a BIG competitor, but it is!
Mobile versus desktop usage is the MAIN competition among internet users.
Here are VARIOUS stats indicating the TOTAL mobile traffic with desktop web traffic.
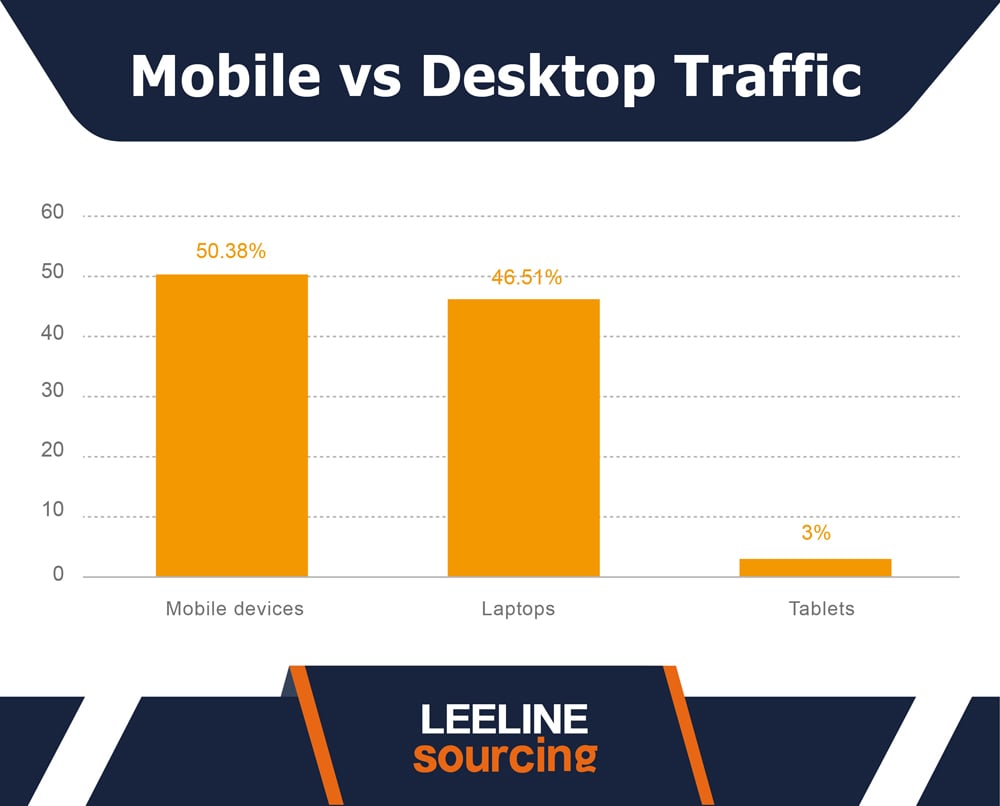
In 2018, mobile devices topped the CHART with the usage of 50.38%. The laptop and desktop computers were on the SECOND NUMBER.
They contributed a share of 46.51%. Tablet users were around 3%.
In 2019, mobile devices showed a rise in the GRAPH.
From 50.38% to 53% is a HUGE statistic for mobile device usage. Desktop computers again made second on the NUMBER. There was a decrease of 2-3% in the total CONTRIBUTION. Yet it has a HIGHER percentage of share in the entire claim.
The tablet remains THIRD on the list. Tablet users are very much fewer, making it an IMPORTANT device.
However, we have to include it in the LIST also.
In 2023, mobile browsing stats still SURPRISE you. It has shown an EXPONENTIAL growth in five years.
Now, mobile surveys has shown a growth of 9%. It has reached 59.42% of the total INTERNET USAGE.
Desktop device usage has shown a DECREASE. It lowered to 38.53%. The decrease is around 8%.
Tablet users have decreased from 3% in 2018 to 2.05% in 2023.
Mobile versus Desktop Internet Usage
What do you use the MOST?
Is it mobile internet usage or desktop?
For me, it is a mobile device. I use hundreds of GBs every month from my Wifi network. And my daily use is around 4-5 hours at least.
Both mobile and desktop are the TOP competitors for traffic and internet usage.
In offices, we can say DESKTOP dominates. But globally, mobile usage is at the TOP.
Here are some statistics comparing mobile with a DESKTOP computer.
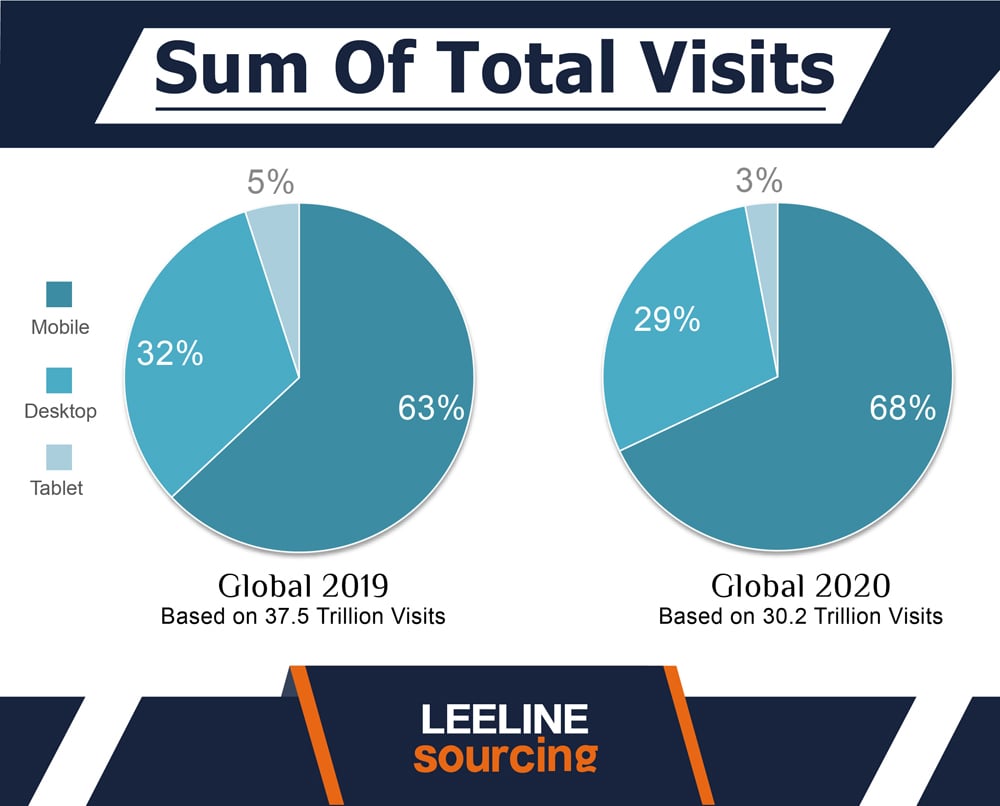
Total Website Visits across different devices in 2019
In 2019, total visits across MULTIPLE devices were around 37.5 trillion. The significant SHARE is by mobile internet use.
- Mobile has the MAXIMUM percentage of share. It is 63% of the TOTAL global traffic.
- The desktop comes on the SECOND number. It has a share of 32% of the TOTAL traffic.
- The tablet is also an IMPORTANT part of the list. It has the PERCENTAGE of 5% on the list.
Traffic from the US alone was around 5.7 trillion. It shows a DIFFERENT picture of the visits. Here is the LIST of stats regarding this.
- Mobile showed a share of 57% compared to 63% in TOTAL global usage.
- Desktop website visits were around 37% of the DESKTOP users. There was an increase of 5% from 32% to 37% of the TOTAL usage.
- Tablet use in the US is slightly high. So, it showed a 6% share.
Total Website Visits across other devices 2020
In 2020, global visits decreased to 30.2 trillion. It again has the SHARE across multiple devices. The mobile, desktop, and tablet devices have DIFFERENT stats.
These are as:
- Mobile visits showed a rise of 5% from 63% to 68%.
- There was a SLIGHT DECREASE in desktop internet users. It had around 29% share, with a Tablet use of 3% for browsing.
In the US, the total number of visits is five trillion. Here are the DETAILED stats.
- Mobile showed a 61% contribution.
- Desktop exhibited a 36% share in the TOTAL visits.
- The third number is if the Tablets with 3% share.
Time Users Spend on Mobile and Desktop
There are TWO THINGS.
- Website browsing.
- Social media browsing.
Mobile devices are MORE COMMON when running the apps. People use Whatsapp to contact others. Use the SOCIAL MEDIA. And many more apps.
In short, mobile serves some OTHER functionalities compared to Desktop.
But when it comes to Website browsing, here are some stats.
- Mobile website browsing time is LESS than the desktop site. You might wonder, how? It is because people do not like to WAIT for the website to take a long time to load. According to the DATA PORTAL, an American spends 4 hours on a desktop and 3 hours on a mobile.
- The data portal has shown some statistics on WORLDWIDE usage. According to it, people spend 7 hours in total. Three hours and 16 minutes is often the MOBILE TIME for browsing.
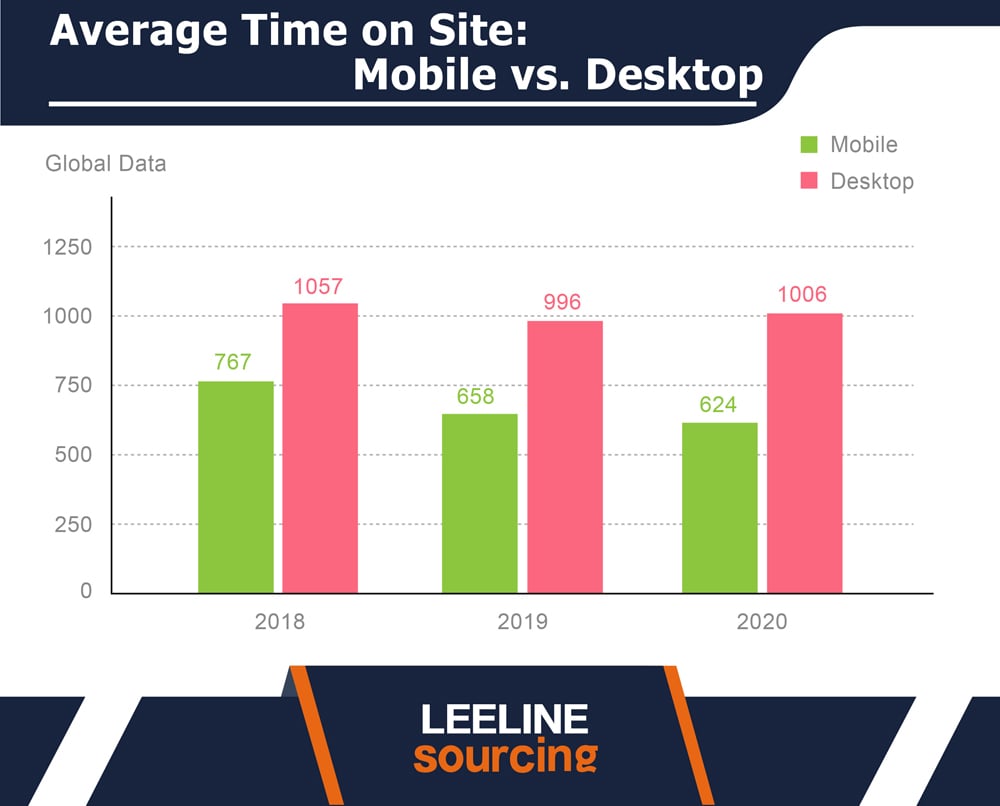
- Smerush has shown some statistics about mobile and desktop time. The average time spent on a website for a mobile device was 767 seconds in 2018. Compared to it, 1057 seconds was the average time spent on a website.
- In 2019, mobile users spent less time with 658 seconds. And in 2020, this time was reduced to 624 seconds.
- In 2019, 996 seconds was the AVERAGE time by a desktop user. In 2020, this time rose to 1006 seconds.
Pros and Cons of Mobile and Desktop
Mobile devices are COMPARABLE with desktop devices.
Do you know why?
Because these ARE TWO primary mediums for internet usage. Tablets somehow contribute but NO VERY MUCH!
It won’t be a BIG problem even if we neglect it.
The pros and cons of mobile and DESKTOP usage indicate their SIGNIFICANCE.
Here are these:
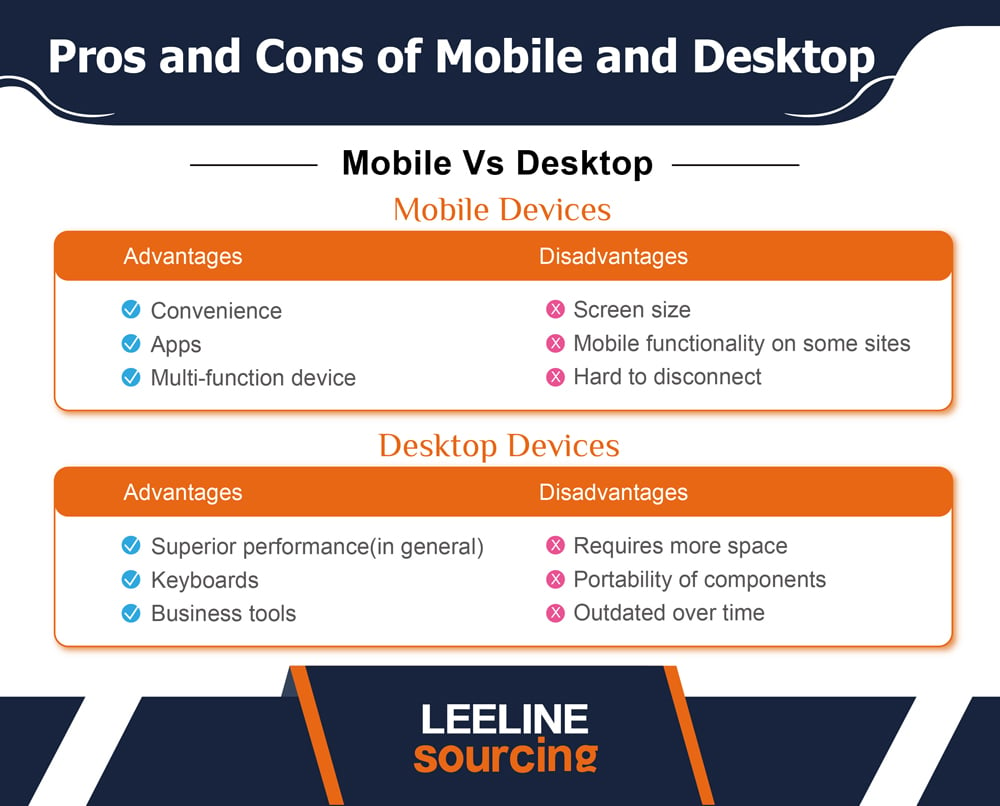
Mobile Devices
The mobile experience is FAR better because of ultimate ease.
You want to search for something. Get your Mobile out of your pocket. And use—no hurdle to carry large devices.
Here are some pros and cons.
Pros:
- Easy to carry wherever you go.
- Multiple mobile apps decrease the hassle.
- Numerous tasks can be done.
Cons:
- The size of the screen is VERY SMALL.
- Mobile sites create Difficulty for online purposes.
- Hard to disconnect.
Desktop Devices
Desktop devices are ALTHOUGH popular. But they offer HIGH flexibility for more significant tasks. For example, if you want a DETAILED illustration, desktop web viewing saves time.
Here are some pros and cons.
Pros:
- Access to Business tools
- Bigger screen with the flexibility to use BIGGER tasks.
- Many business tools are available.
Cons:
- Requires more space.
- Outdated over time.
- Difficult to transport or carry due to size and weight.
Mobile Usage Statistics
The trend of the 21st CENTURY keeps mobile devices on the TOP. The number of mobile users is VERY HIGH, in billions.
The total number of MOBILE users is 6.92 billion.
Regarding dividing the ACCOMMODATION per region, here is what you should know!
- An immense TRAFFIC contribution is from Africa. The total percentage is 69.13%. Out of these, Nigeria has the HIGHEST proportion. 81.43% is the TOTAL share from African countries.
- Sudan tops the LIST in terms of mobile traffic. It has a share of 83.92%. Russia has the LOWEST mobile traffic share with a percentage of 30.2.
- After Africa, Asia has the SECOND most significant share in the traffic from mobile users. The percentage is 65.2% of the traffic.
- South America makes the THIRD NUMBER on the list. It has a traffic of 51.47%. Its traffic is less than the GLOBAL mobile traffic.
- Similarly, Europe has 49.19%, and North America has 48.49%. The last rank is Oceania, with mobile statistics of 39.51%.
| RANK | REGION | MOBILE TRAFFIC SHARE |
| 1 | Africa | 69.13% |
| 2 | Asia | 65.2% |
| 3 | South America | 51.47% |
| 4 | Europe | 49.19% |
| 5 | North America | 48.49% |
| 6 | Oceania | 39.51% |
Mobile App User Statistics
Cell phones have NUMEROUS features. Do you know the FASCINATING part?
It is the installation of apps. For example, you want to connect with your FAMILY. Install social media apps such as FACEBOOK or skype. Enjoy video calls and voice message experiences.
The even more surprising thing is GLOBAL mobile traffic. More mobile users than the DESKTOP compel a great business.
Let’s know the different statistics related to mobile apps.
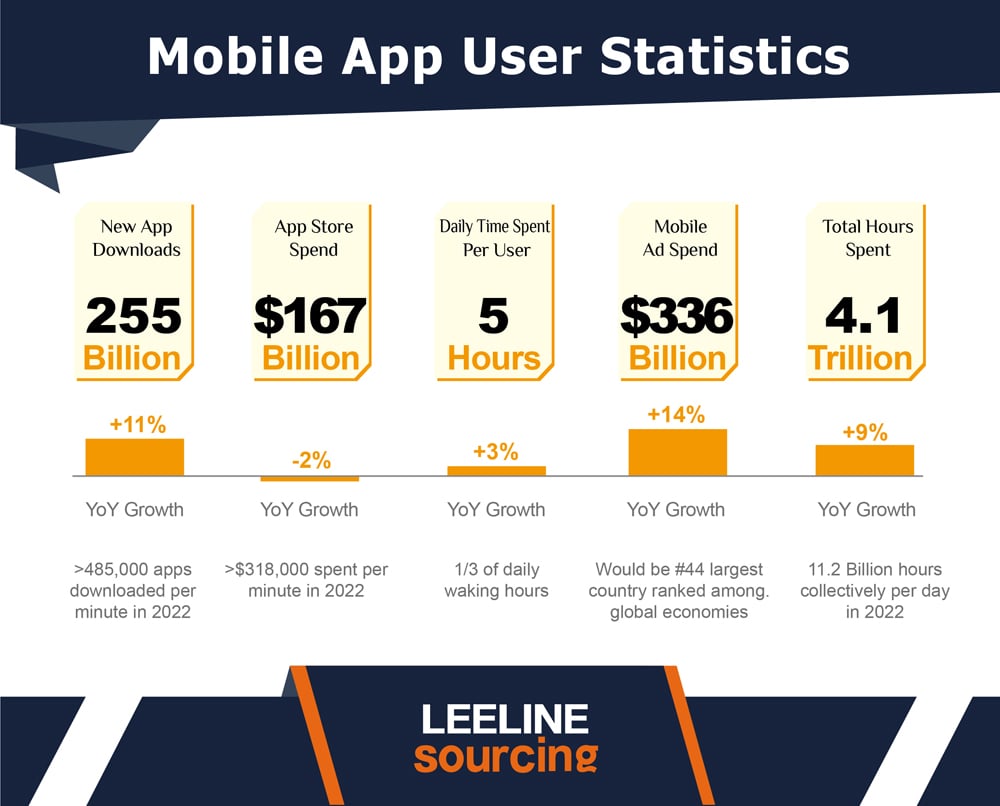
A report from Data.ai describes all.
- New App Downloads: There are 255 billion app downloads in the SINGLE year of 2022. A game user might download the app one or MORE TIMES. Can you reckon such stats? It was an INCREASE of 11% compared to 2021.
- App store spends: Total app store spend was 167 billion USD. It includes app purchases or in-app purchases.
- Daily Time spends: A single user spends over 5 hours a day. It is not such SMALL mobile browsing stats that go unnoticed.
- Mobile Ad spends: Businesses spend 336 billion USD on mobile ads. It is such a BIG SOURCE for advertisement.
- Total Hours Spend: In 2022, the Total hour spent was 4.1 trillion. It showed a 9% increase compared to 2021.
Mobile Social Media Statistics
Social media is one of the POWERFUL sources of online traffic. 4.76 billion PEOPLE use social platforms.
Browsing social media is a CASUAL activity, especially for me.
So, there are some stats related to its usage on different devices. These are:
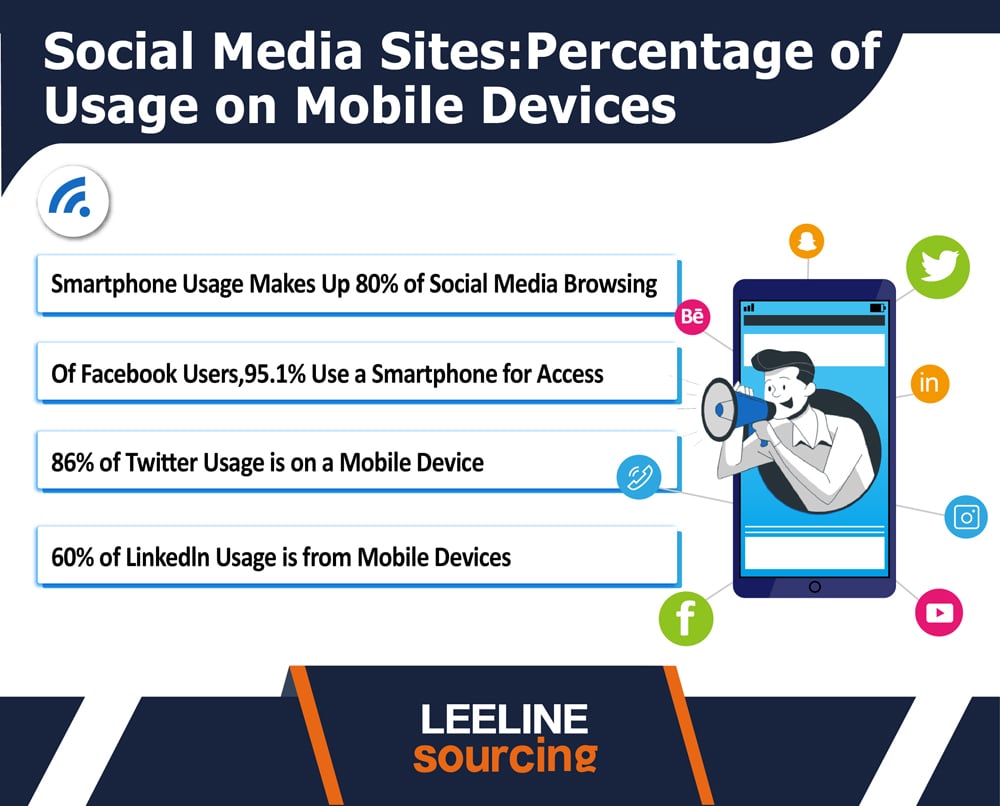
- About 80% of social MEDIA TRAFFIC sources are smartphones. 20% of people use Desktop sites or tablets for Facebook.
- About 95.1% of Facebook users access it through MOBILE DEVICES. Facebook has multiple apps. Like Facebook Messenger, FB lite, etc.
- Twitter is one of the TOP 10 social sites. About 86% of Twitter users are on Mobile phones. They use the Twitter app to access their accounts.
- 60% of LinkedIn users use the mobile app.
Mobile Marketing Statistics
Advertising campaigns are POPULAR. There is not a GOOGLE-only giant in the market.
Instead, you have access to the:
- Facebook Ads
- Amazon Ads
- Other Social Media ads
And there are different varieties of marketing in it. The SIMPLEST form is influencer marketing.
When it comes to marketing share, here are different stats.
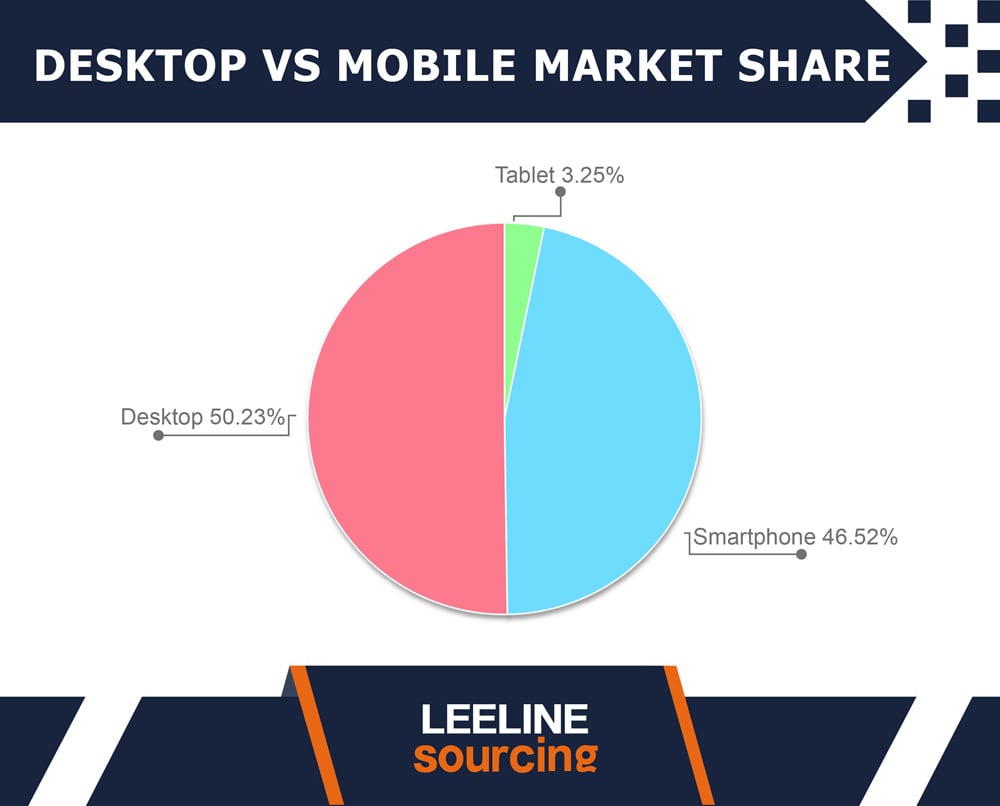
- The desktop leaves the MOBILE DEVICES behind. The desktop market share is 50.23%.
- The smartphone is second on the LIST, with a market share of 46.52%.
- The tablet is last on the NUMBER. It has a market share of 3.25%.
Mobile E-commerce Statistics
Mobile eCommerce is also ANOTHER POPULAR topic. Rapid eCommerce growth is due to mobile devices.
Amazon or Shopify are mobile-optimized websites to give EXCELLENT experiences to users.
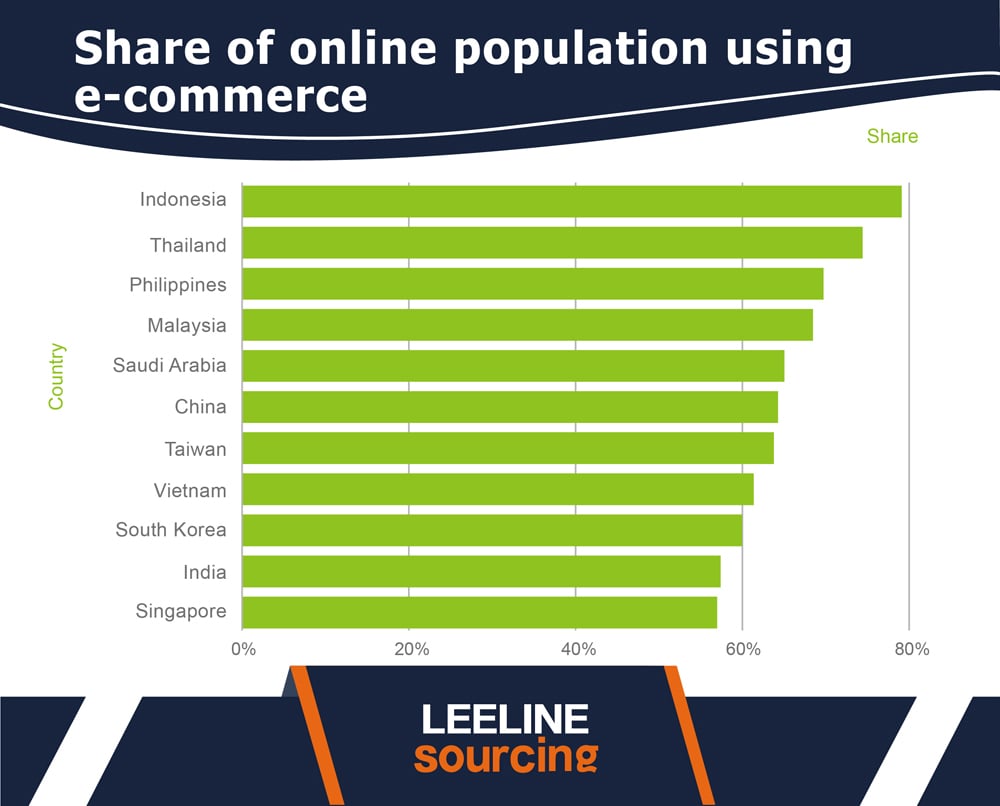
Here is the CONTRIBUTION of different countries.
- Indonesia is at the TOP of the list. It has a TOTAL SHARE of 79.1%.
- Thailand makes the second number on the LIST. It has a share of 74.2%.
- The Philippines is third on the LIST. It has a share of 69.6%.
- All of the ASIAN countries are on the Top of the list. India is the 10th number with a share of 57.3% on mobile.
What’s Next
Users prefer to use MOBILE. It is because:
- Mobile UX is better.
- The mobile version consumes less time.
- Social media browsing entertains us every time.
That is why mobile INTERNET users are more than desktop users. Mobile has 60%, while desktop has 40% users.
Do you want to KNOW more stats for mobile and desktop users?
Go through our WEBSITE. All data is AUTHENTIC. You’ll get worthy information.