Sales METRICS have always been a KEY. 50-75% of the businesses just TARGET this aspect.
And do you know what they achieve?
They TRACK DOWN their MARKETING blunders. Improve them. And RETAIN a HIGH CUSTOMER VALUE with 70% greater sales opportunities.
Need VERIFICATION?
Statista report shows the SIGNIFICANCE of sales funnel statistics. According to it, 76% of the COMPANIES measure their SALES performance in 2022. 24% didn’t have a DEFINITE PATHWAY to do it.
Want to know more about sales funnel STATISTICS?
This article deep dives into the sales funnel and explores its significance.
- What Is a Sales Funnel?
- Most Popular Sale Funnel Builder
- What Is a Good Sales Funnel Conversion Rate?
- General Sales Funnel Statistics
- Sales Funnel Landing Page Statistics
- Sales Funnel Email Marketing Statistics
- Sales Funnel Conversion Rates Statistics
- Sales Funnel Lead Nurturing Statistics
- 6 Key Funnel Metrics
- What’s Next
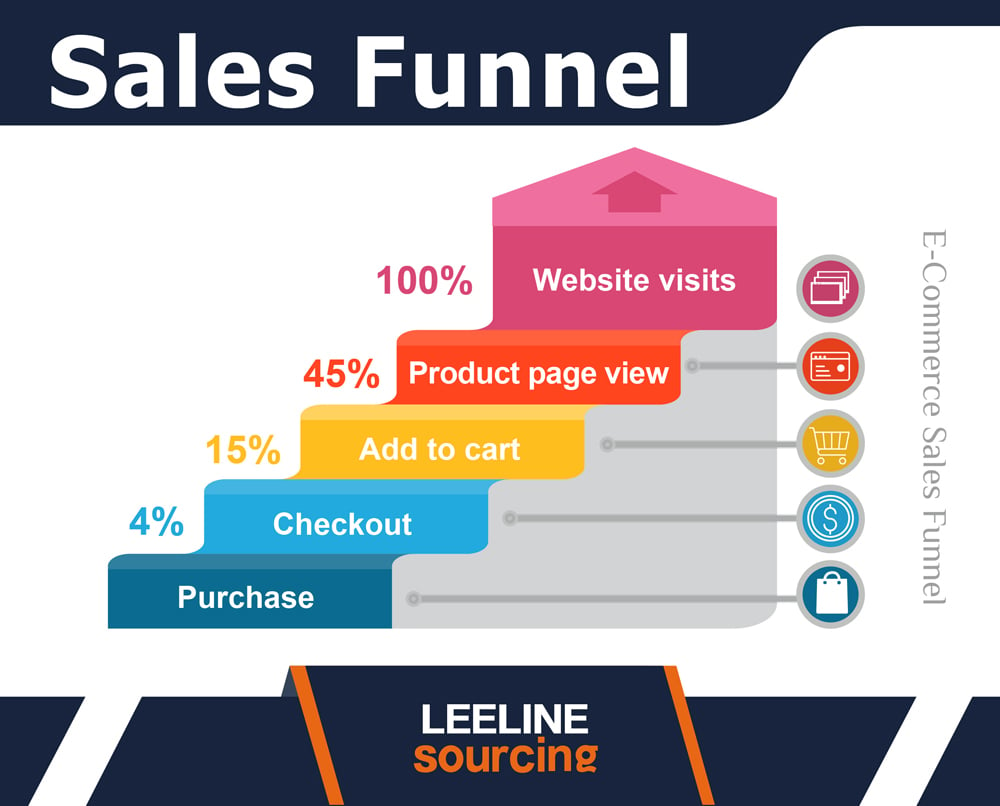
What Is a Sales Funnel?
Sales FUNNEL is one of the MOST POPULARLY used terms in the eCommerce industry.
The sales funnel is the SKETCH of the customer journey to purchase products. It starts from WEBSITE VISIT to adding items to carts. And finally, buying after the payments.
Marketing TEAMS put marketing efforts to drive more SALES.
Most Popular Sale Funnel Builder
There are a BUNCH of tools to input MARKETING efforts. By using those tools, you get Detailed analytics of your MARKETING efforts. How a single customer behaves. And how the SALES are going to increase.
Want to know WHICH sales and marketing funnel tool is on the TOP?
Get here!
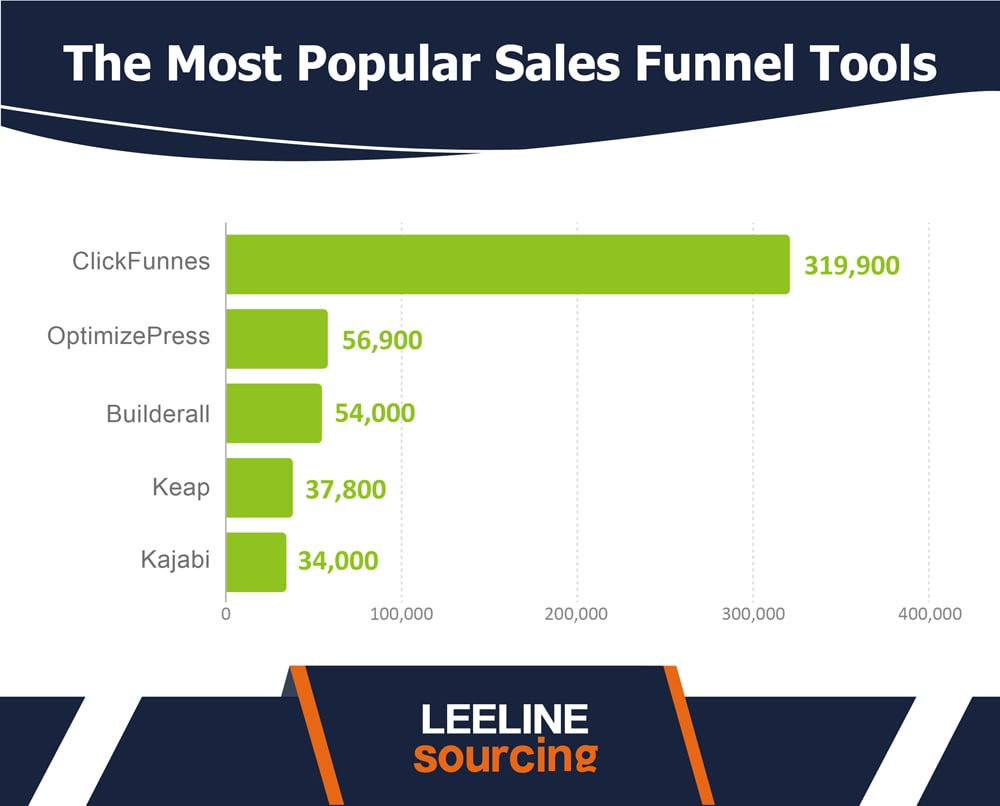
- ClickFunnel is LEADING the chart as a website builder. In 2021, 319,900 websites were BUILT using the ClickFunnel tool.
- ClickFunnel is the Biggest funnel BUILDER in the market. It has a SHARE of 55.8%. In contrast, the OPTIMIZEPRESS is 9.9%.
- OptimizePress is the SECOND best builder after Clickfunnel. It has built 56,900 websites for the marketing and sales teams.
- The third tool is BUILDERALL. It has built 54,000 websites.
- The fourth rank goes to the KEAP. It has built around 37,800 websites for customer acquisition.
- Kajabi is the FIFTH ranked conversion funnel tool. It has built 34,000 websites for customer acquisition.
What Is a Good Sales Funnel Conversion Rate?
High CONVERSION RATES increase sales. Therefore, numerous companies use TARGET ads and marketing tactics to generate leads.
Do you want to know how MANY SALES teams believe in the conversion process? Here are the marketing funnel metrics.
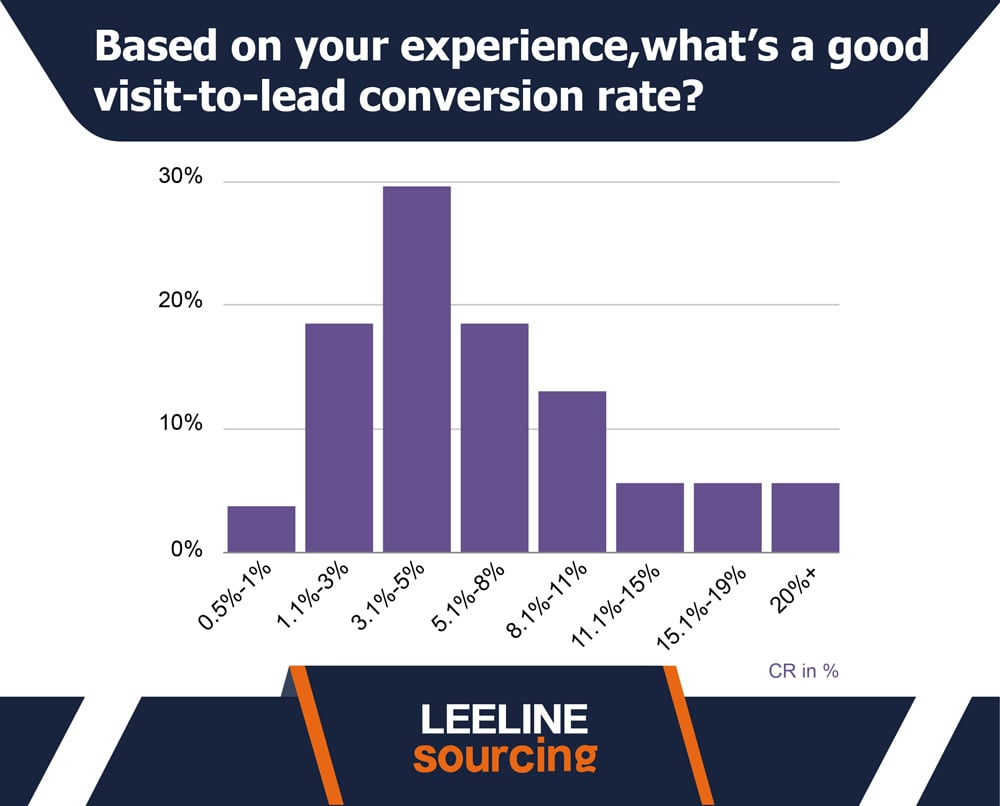
- 3% of the companies believe a 0.5-1% conversion rate is GREAT. It helps them hunt clients.
- 19% of companies favored the CONVERSION rate of 1.1-3% conversion.
- 3.1%-5% conversion rate was the HIGHEST rated conversion. 30% of the companies favored this rate.
- 18% of companies voted for the 5.1-8% conversion. It was the BEST RATE for generating leads with adequate budgets.
- 14% of the companies agreed to the BEST CONVERSION RATES. Their rate was 8.1%-11% rate.
- 5% of the companies favored 11.1%-15% as the BEST conversion.
- For another 5%, the best rate was 15.1%-19%.
- 20%+ conversion rate was voted by 5% of the companies.
General Sales Funnel Statistics
Most important funnel metrics have generated BILLIONS OF DOLLARS FOR the companies. A review of marketing strategy uncovers the EXACT errors and improvements.
Marketing qualified leads are ONLY POSSIBLE with the right strategy. Blogs and video content help generate paying customers.
Here are SOME GENERAL STATISTICS for funnel metrics.
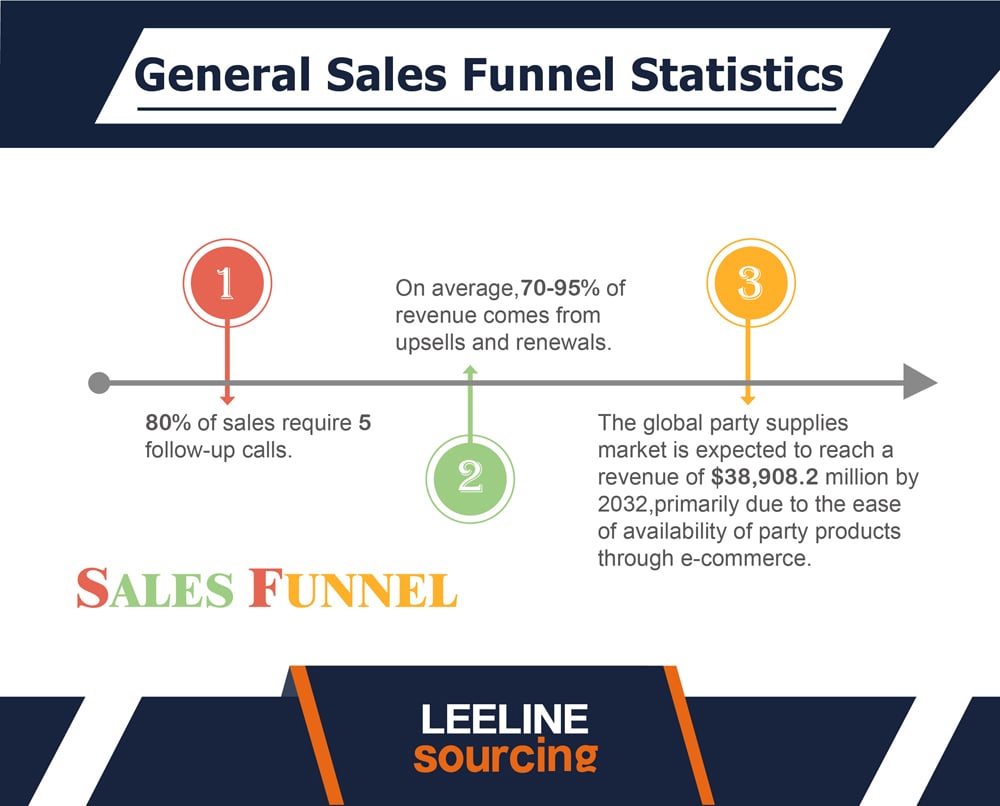
- There are at least five follow-up calls to achieve 80% sales. Sales VELOCITY increases with the number of calls.
- Existing customers are the TREASURES for the marketing strategy. 70-95% of the sales rely on UPSELLS AND RENEWALS. Old and permanent customers tend to buy more compared to new customers. 90% of customers focus on RETAINING customers to get better funnel metrics.
- The global party market size will reach 38 BILLION USD by 2032. It is due to EASY ACCESS to products and availability.
- 96% of the ORGANIC traffic never purchases an item. First, they know about BUSINESS. And read the reviews. It helps them demonstrate whether they should buy or not.
- 95% of prospective customers NEED ENOUGH content for purchase. They think a business should have ENOUGH TRUST and deals to convince them to purchase items.
- Embedding a video on a LANDING PAGE generates more conversion. Lead generated by the video reaches 80% of the TOTAL VISITS.
- The highest CONVERSION RATE is for vocational studies & job training. It is 6.1%.
- The average conversion for LEAD GENERATION is 4.02% for at least ten industries.
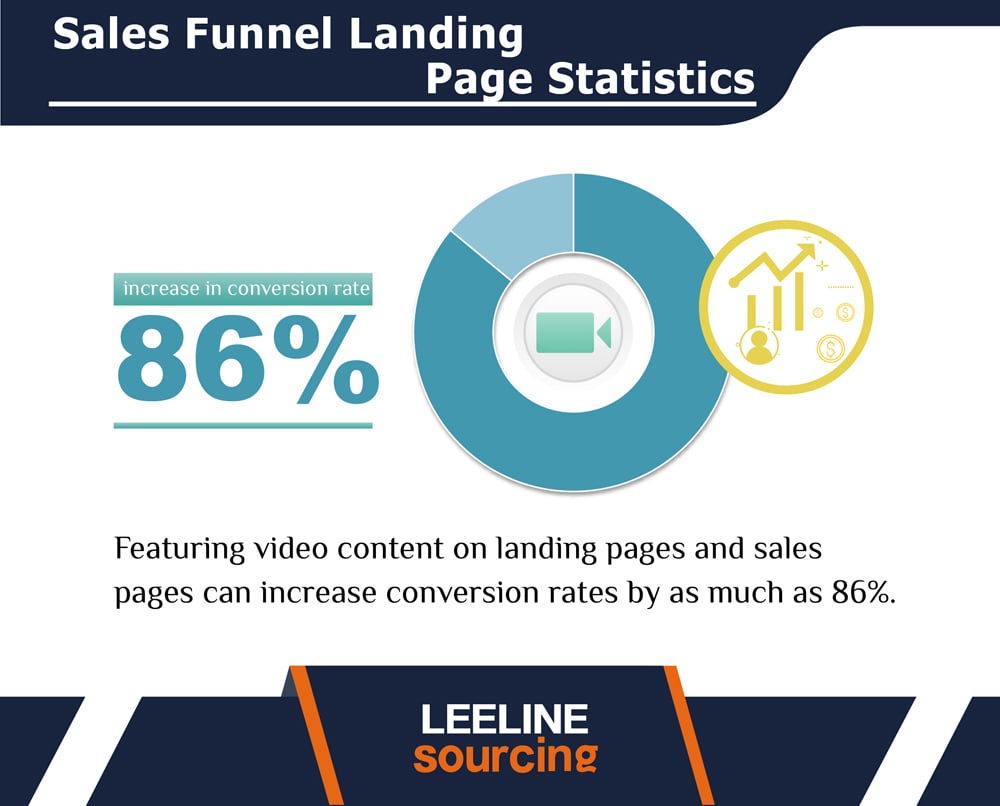
Sales Funnel Landing Page Statistics
I opened a WEBSITE YESTERDAY. The first thing I looked at was the LANDING PAGE. Not only was the page attractive, but also the content.
The owner added the videos. And you can’t believe it; I just loved it. It is where I thought about the importance of landing pages for customers.
There are THOUSANDS of such cases. Even different sales funnel metrics show that. These are:
- Uploading video CONTENT on the landing pages can POTENTIALLY increase your conversion. You can expect 86% more CONVERSION with a video than without one.
- At least 8 IMAGES AND 5 videos should be on a PAGE. It is what 90% of the product shoppers between 18-35 expect the people to have.
- Landing pages with a SOCIAL PROOF have a better conversion. They generate 12.50% more conversion compared to 11.40% without it. It is a STRAIGHT 1.1% difference. In the marketing funnel METRICS, it is a significant difference.
- Around 36% of the OWNERS upload testimonials of potential customers. About 30% upload a VIDEO SHOWING their trust in the CUSTOMER journey.
- 4 out of 5 CUSTOMERS check the HEADING of the landing pages. Only 1 out of 5 read the whole ARTICLE or blog.
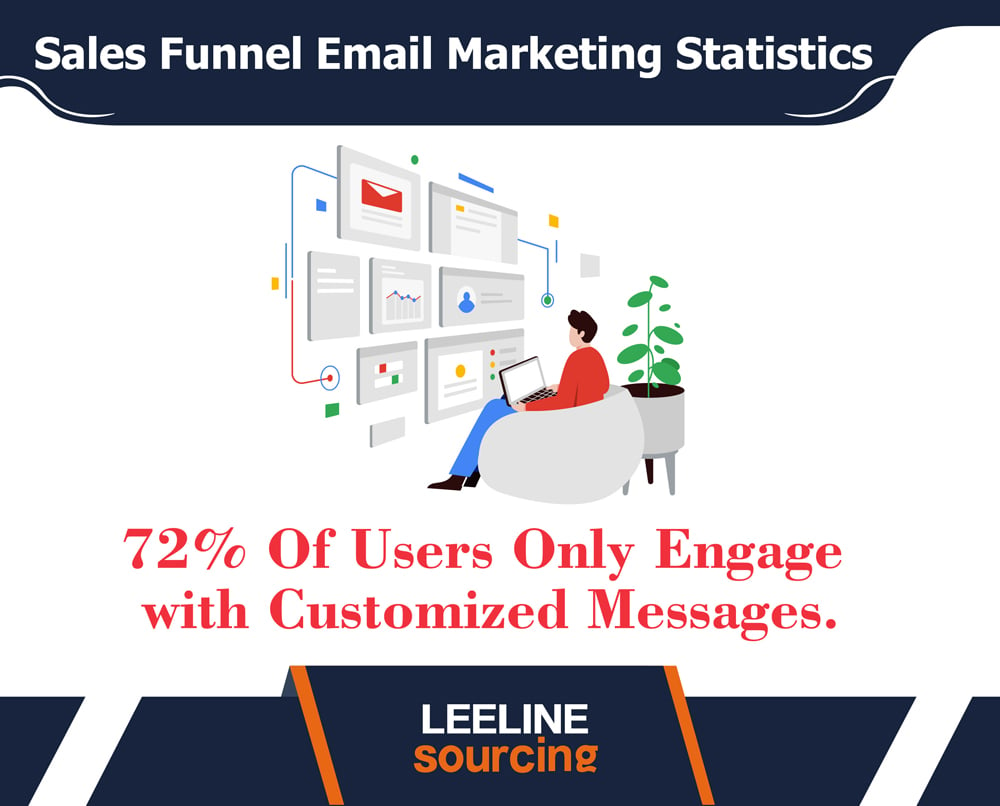
Sales Funnel Email Marketing Statistics
Email is a POPULAR MEDIUM to generate leads and make sales. The average customer LIFESPAN takes 7 seconds to read an EMAIL. If you convince OFFERS, you can create more sales. Total revenue dramatically increases in such cases.
Here are the SALES FUNNEL metrics associated with the emails.
- The BEST MONTHS for the email click and open rates are June and FEB. February has the BEST OPEN rate. It is 17.9%. June has the BEST CLICK rate. It is 3.6% of the TOTAL emails.
- 64.4% of the USERS open an ORDER CONFIRMATION email. They check the pricing details and Other info. The click rate of such emails is 18.1%.
- The order rate for the CART recovery emails is exceptional. It gets 2.4% of the SALES.
- 48% of the MARKETERS target emails for customer acquisition. The cost per lead with emails is LOW.
- 36% of MARKETERS agree that their EMAILS campaigns bring results.
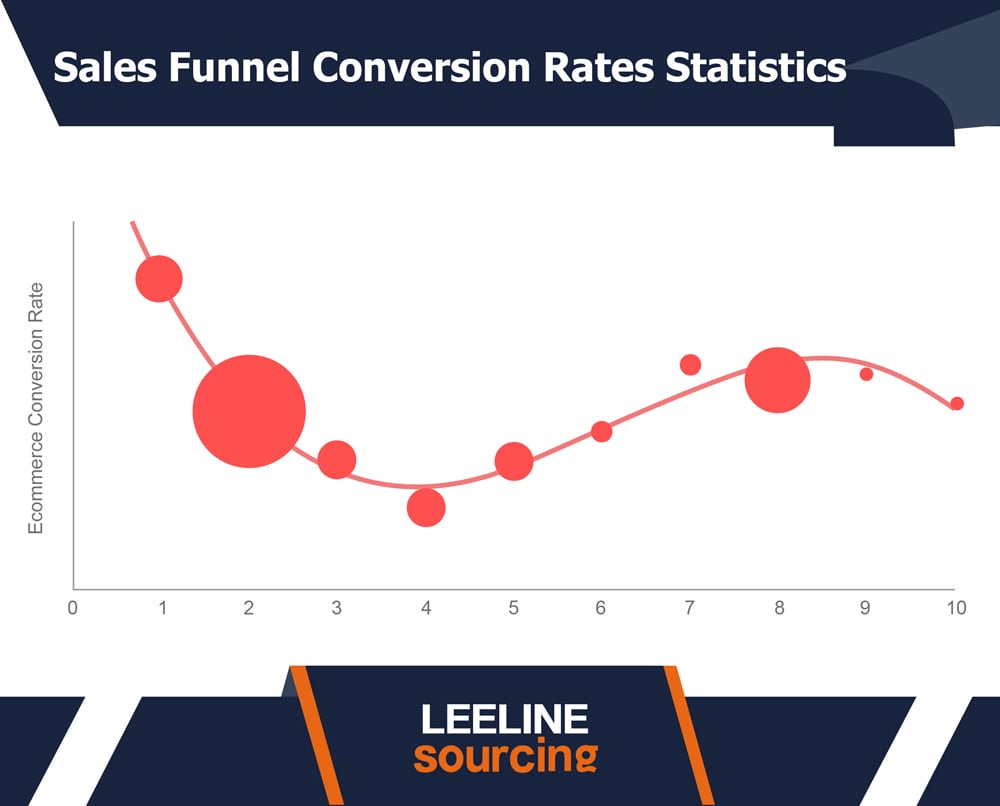
Sales Funnel Conversion Rates Statistics
If I talk about CONVERSION 1000 times, I think it is LESS.
Your TOTAL REVENUE Depends on conversion. Even your brand is staked at the better conversion. Therefore, you should know MARKETING funnel metrics for better results.
You should TRACK the sales funnel metrics. Locate the POTENTIAL mistakes in your sales and marketing efforts. And finally, be the EINSTEIN in the marketing funnel.
Here are vital sales funnel metrics for conversion.
- The average CONVERSION ratio of a LANDING page is 2.35%.
- Site browsing and opening speed is key in the average purchase. The average LOADING SPEED of 1 second is 2.5 TIMES more effective than 5 seconds. It generates 2.5 times MORE CONVERSION.
- The loading speed of 1 second generates 1.5 TIMES more conversion than 10 seconds.
- An average 1-second LOADING time has a 40% conversion ratio. Compared to it, 2 seconds of loading time has a 34% conversion ratio. The 3 seconds has a conversion ratio of 29%.
- CTA pages have a HIGH conversion ratio. It is around 13.50% making it a KEY FACTOR for businesses.
- Website pages having five or more 5 CTA generate 10.50% of the conversion.
- Pages with COMPRESSED IMAGES load quickly. Therefore, they have a conversion ratio of 11.40%. On the other hand, uncompressed IMAGES have a CONVERSION ratio of 9.80%.
- Pages using email as an ACQUISITION channel have HIGH CONVERSION. It is around 13% compared to other pages and types.
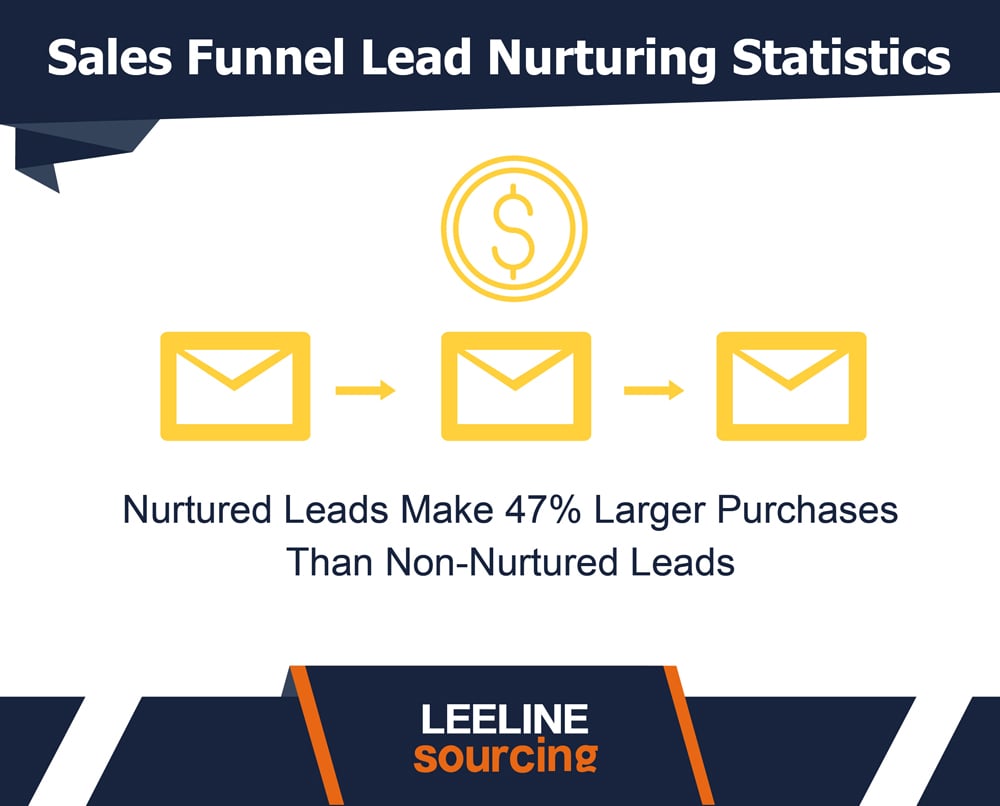
Sales Funnel Lead Nurturing Statistics
Nurturing LEADS refers to applying multiple techniques. For example, you upload the VIDEO on the landing pages, and it increases sales opportunities by 80%.
Every single factor in the LEADS is crucial to achieving high business growth. Here are some more funnel metrics indicating lead nurturing.
- Nurtured leads have 47% more average PURCHASE VALUE compared to other ones. It is pretty VALUABLE to nurture the leads in the best ways.
- Analyzing funnel METRICS is quite impactful for the business. You come to know the BASIC blunders in the LEADS. 68% of the companies haven’t measured their metrics.
- Marketers consider the CONVERSION to be an essential part of leads. 69% of marketers prioritize the conversion of visits.
- 44% of the SALES TEAMS abandon their EFFORTS after a single failure. Trying, again and again, brings the REAL RESULTS.
- Responsiveness is the MAIN FACTOR customers notice. 30-50% of sales occur with QUICK and effective responses.
- Social media TRAFFIC and GOOGLE traffic are both significant challenges. 65% of businesses agree with this fact.
- Lead nurturing can be your BLACK MAGIC. 65% of the COMPANIES don’t know how to nurture their leads. Their attempts fail due to a lack of a DEFINITE sales process.
6 Key Funnel Metrics
Important METRICS on the top of the FUNNEL are below.
Branding
The brand awareness stage is SUPER CRUCIAL for a business. It shows:
- How much do customers buy from your brand?
- How many customers talk about your BRAND?
- How many customers type your BRAND name in the search engine?
Taking NOTE OF such funnel metrics is a GAMECHANGER for marketing decisions.
Sales
One of the key performance indicators is the number of sales generated. Some CUSTOMERS visit. Some add the products to the carts and buy them.
Sales performance is SUCCESSFUL when you convince customers to buy the products. The FAST and more purchases mean successful sales and marketing efforts.
Costs
Your marketing and sales efforts should have a SINGLE FOCUS.
Generate REVENUE. Increase sales REVENUE. Total revenue generated!……
Costs are an IMPORTANT marketing funnel factor. It shows how much you INVESTED in generating the leads. The following types of costs often come into these sales funnel metrics.
- Cost per lead (CPL)
- Cost per sale (CPS)
- Customer acquisition cost (CAC)
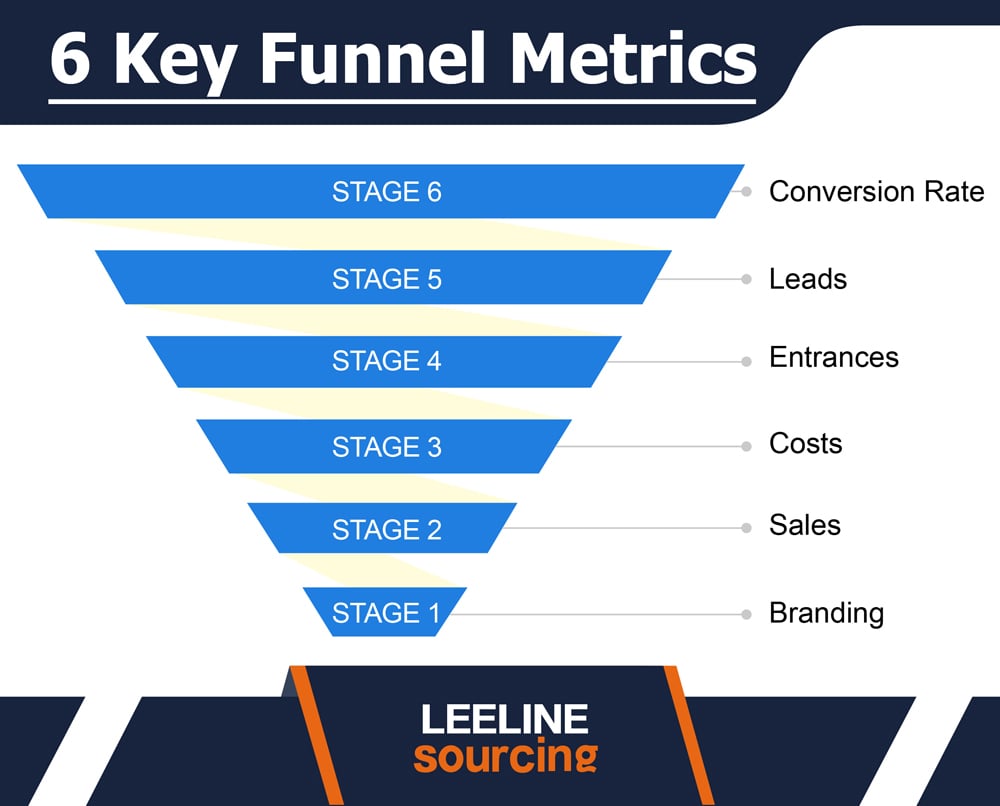
Entrances
Entrances refer to the TOTAL number of customers that marketing campaigns. That means those interested MEMBERS who subscribe to your newsletter lists.
It indicates the ORGANIC SEARCH traffic with the paid ads. The marketing and sales team implements its optimal plan to have more entrances.
Leads
People often MISCONCEPT this term. Anyone who shows INTEREST in buying your item is a LEAD. We divide it into two parts.
- Marketing qualified leads (MQL)
- Sales qualified leads (SQL)
In marketing STRATEGY, MQL comes first. The customers visit your website. They purchase it. And finally, we call it SQL.
Conversion Rate
Conversion FUNNEL refers to converting customers from visits to purchases. In the MARKETING STRATEGY, businesses aim at target audience conversion.
Funnel stage conversion rates can BRING FRUIT to your marketing and sales efforts. For example, suppose the purchasing process is difficult. Simplify it and BRING more customers into the entire sales cycle.
What’s Next
Sooner, the COMPANIES will realize the IMPORTANCE of the sales funnel. The increasing use of builders like CLICKFUNNELS has generated better results. You get the DETAILED METRICS and correct the lacks. The stats from 76% of companies will move to 90% sooner or later.
Want to know more sales funnel statistics?
Visit our LEELINE website to learn more detailed statistics!