Social MEDIA has the rising SLOPE moving upward exponentially. Just imagine we have a TOTAL population of 8 billion on this EARTH.
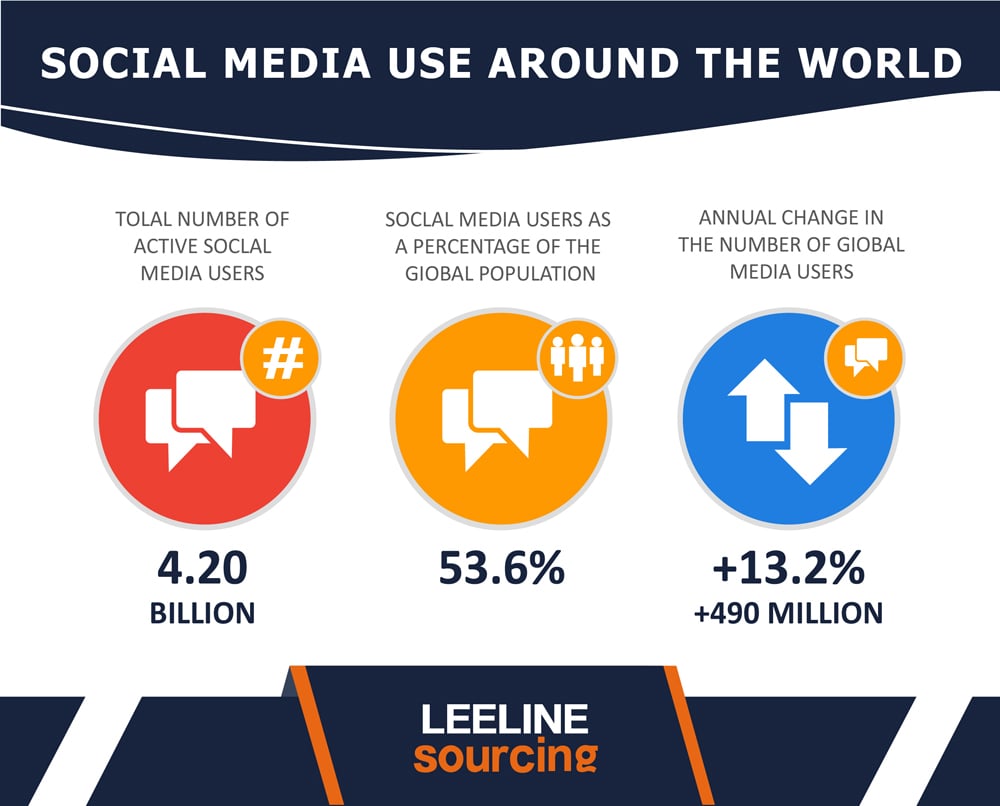
Of these, 4.76 billion MONTHLY ACTIVE users are on major social media platforms. Such social media statistics indicate how GIANT the social platforms are. It is around 59% of the TOTAL population right now.
The current SOCIAL MEDIA GROWTH is over 10% per year. That means, in the upcoming years, you can expect 70-80% of the population to use SOCIAL SITES.
From a business aspect, it is an opportunity to ACHIEVE goals. Ad spending and ROI are around 5X. What else do you even need?
Want to know more about social platforms?
This guide will ELABORATE on different social media trends and statistics.
Let’s GO!
Two words and the GAME is OVER.
Social. Media.
That means a medium to connect with other people. Interact with them. Share your IDEAS. Know about them. And listen to what they say.
Maybe it is a COMPLEX DEFINITION. Social media is the WAY to communicate with people about anything.
I believe we have USED at least one POPULAR SOCIAL media platform.
Is that right? Let’s know more about that.
Social media has nectar. You want to know more about them, right?
Stay CONNECTED with your whole mind.
Instant Online Discussions
Have a business meeting? Turn up your ZOOM application. Send links. And call for a MEETING.
Even every social media platform has this OPPORTUNITY. Skype, Facebook, Whatsapp, etc.
Not only business meetings but also you can HOLD local meetups. Video calls are a COMMON way to talk to distant friends.
Free Source
There is no FEE to use a social platform. Whether it is your business or domestic purpose, go AHEAD. Connect with other people.
Enjoy. And let the GAME on unless you turn it off.
Isn’t it a COOL way for you?
Best Resource for Businesses
Want to promote business?
Go for the ADVERTISEMENTS. Sell your products on social media platforms. They offer ample business opportunities.
The astonishing fact is that:
“Social media Ads conversion rate is 9% while that of GOOGLE ADS is 4%.”
Compare the two stories. You got what RIGHT for your business is.
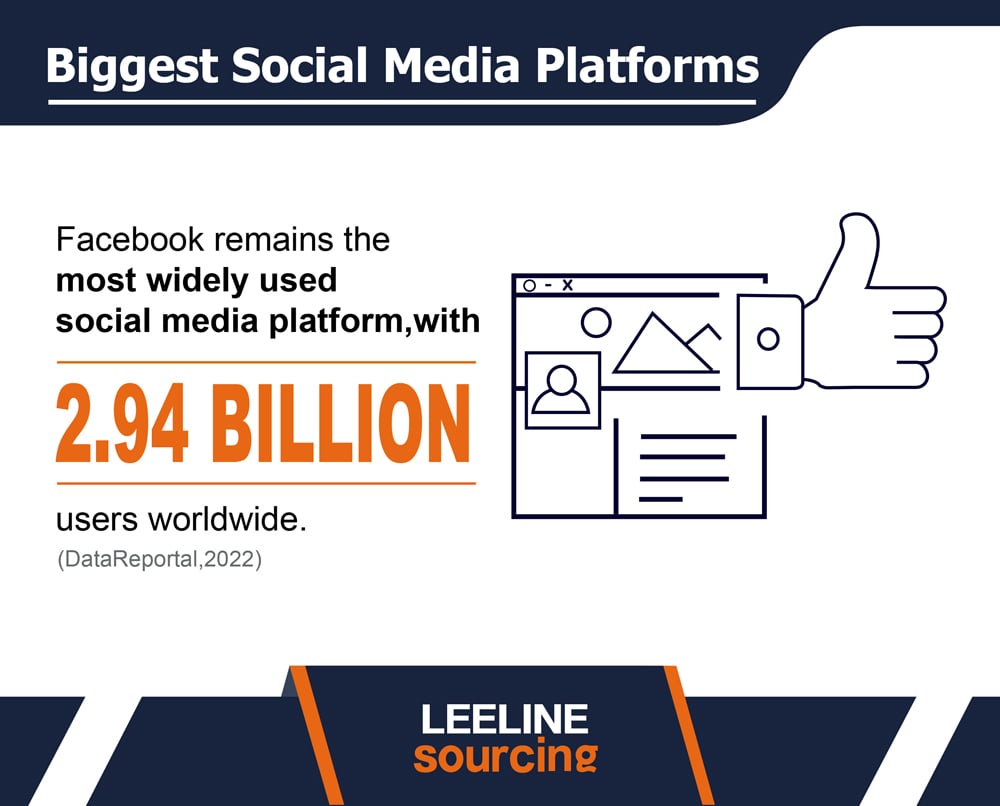
Facebook is the KING of the social media world.
Do you AGREE? I am 100% sure some people will still argue. Believe me; there is nothing to ARGUE about.
You know, why?
Because of real-time statistics of internet users on Facebook.
- Facebook surpassed the 1 billion mark of internet users in 2012. Now it has over 2.94 billion ACTIVE SOCIAL MEDIA USERS. ( A report from DataReportal, 2022)
- Statista REPORT verifies it. In the Q4 of 2022, Facebook surpassed 2.96 billion monthly active users.
- In 2023, Facebook’s revenue was over 117 billion Dollars. ( A report from Statista)
12 statistics you need to know
Social media stats highlight how INTERNET users are moving to these platforms. To prove our claim, we must have STRONG shreds of evidence.
And here are details of different social media statistics with REAL-TIME reports.
Social media users statistics
Social media CONNECTS us with other people. That is not a single reason for people to use it. Instead, there have been other causes, such as marketing, etc.
Social Media has been POPULAR among people. Recent stats project its expansion to 59% of the POPULATION.
Do you WANT to get detailed statistics about internet users on SOCIAL MEDIA?
Get here.
- In Jan 2021, there were 4.20 billion users of the different social media platforms. In 2023, these stats are offering an even HIGHER POPULATION. There are 4.76 billion, covering around 59% of the POPULATION. Such whopping statistics! (Report from Statista)
- Twitter users range from about 73 million. Facebook users have crossed 2.9 billion. In similar cases, Instagram users are over 1 billion. (Report from HootSuite)
- 74% of Americans use SOCIAL media actively daily. Europe has a GREATER number of users, around 79%. Daily active users of Middle Africa are 8%, and Eastern Africa has 10%. (Report from HootSuite)
- Social media is more among females compared to MALES in the US. 78% of the active users in the US are females. Compared to it, 69% are male users, lagging behind the percentage of female users. (Report from HootSuite)
- Active users spend around 2 hours and 25 minutes. The average user on social media networks spends about 1 hour or more. (Report from HootSuite)
Social media usage statistics
All of the SOCIAL media sites are FREE to use. However, some of them give PAID features to the daily active users.
Regarding the HIGHEST number of users, can you guess who the WINNER is?
I believe FACEBOOK. And it is TRUE. But the astonishing fact is that:
“Meta Platform owns THREE out of the FOUR top platforms. Meta owns Facebook, Instagram, or Whatsapp.”
Here are the LATEST social media statistics.
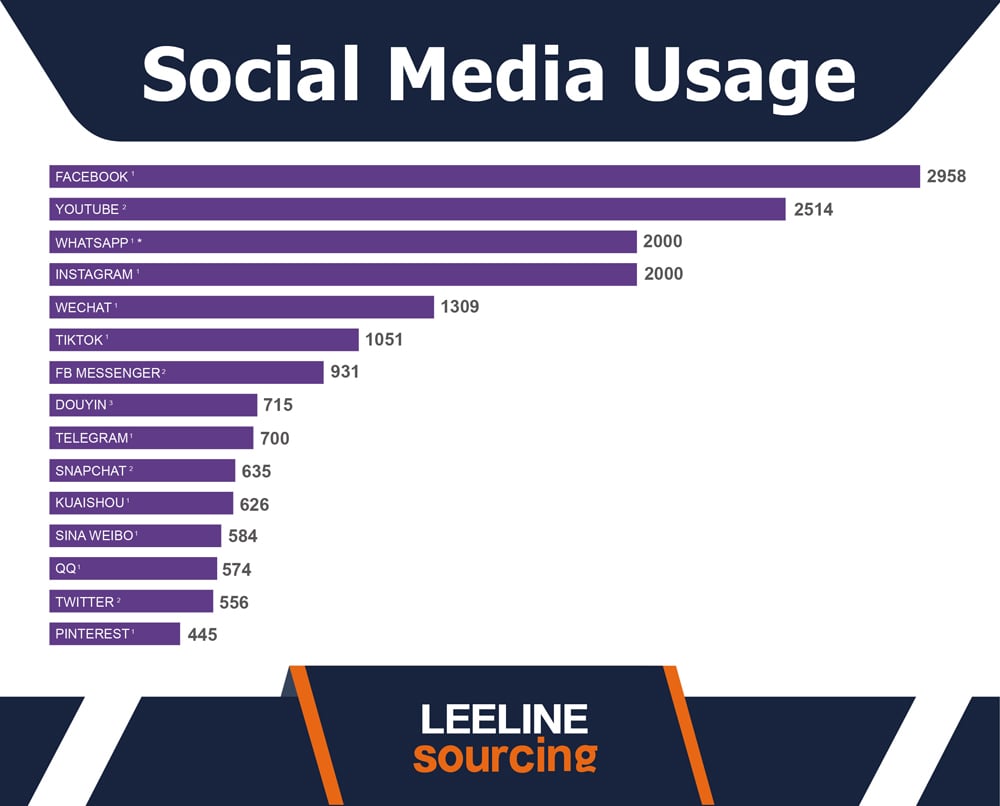
- Facebook is on the TOP with 2.958 billion users. Secondly, Youtube comes with 2.514 billion users.
- WhatsApp and Instagram share an EQUAL number of active users. Instagram users range around 2 billion.
- Meta is the BIGGEST SOCIAL MEDIA company that owns three major platforms.
- TikTok saw a FAST GROWTH of 141% in 2021. It has reached the 6th on the LIST of top social media usage sites.
- 93% of internet users use SOCIAL media sites regularly. At least they have accounts on any Social Platform.
- Over 75% of the world’s population aged 13+ use social media.
You can get more details about Pinterest users, WhatsApp users, and Twitter users.
Social media demographics: gender and age
Who is on the TOP? MALE OR FEMALE?
What do you reckon? As far as I think, it must be an equal ratio. Or maybe the males might lead the chart.
Oh! I am wrong 100%. It is because, in the US, females are ahead of males in using various social media platforms.
Moreover, we can discuss the NUMBER of users based on age as well.
Interested?
Let’s learn more about the REAL-TIME statistics about social media usage.
Facebook Statistics
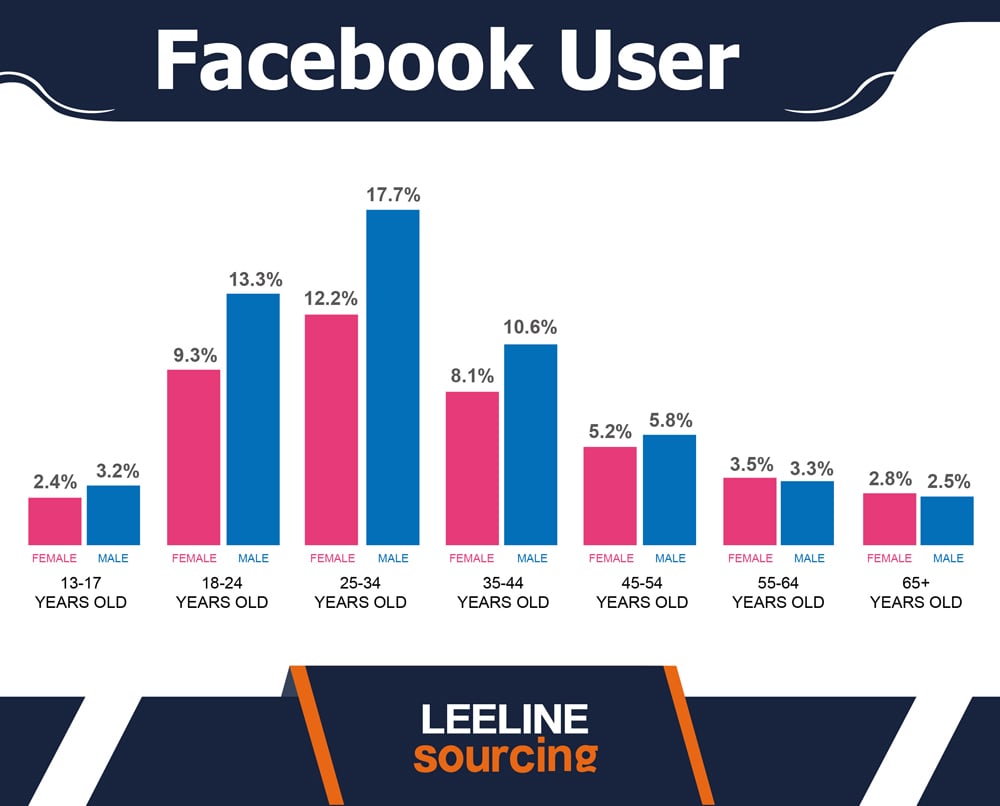
- 5.6% of Facebook users belong to the age group of 13-17 years. The females are around 2.4%, and the males are around 3.2%.
- 22.6% of active Facebook users fall in the age group of 18-24 years. In gender cases, 9.3% are female, and 13.3% are male.
- The highest number of active Facebook users belongs to the age group of 25-34 years. 12.2% are female users, and 17.7% are male users.
- In the 35-44 age group, the percentage of Facebook users is 8.1% females and 10.6% males.
- In the 45-54 age group, the percentage of Facebook users is 5.2% females and 5.8% males.
- In the 55-64 age group, the percentage of Facebook users is 3.5% females and 3.3% males.
- In the 65-plus age group, the percentage of Facebook users is 2.8% females and 2.5% males.
Youtube Statistics
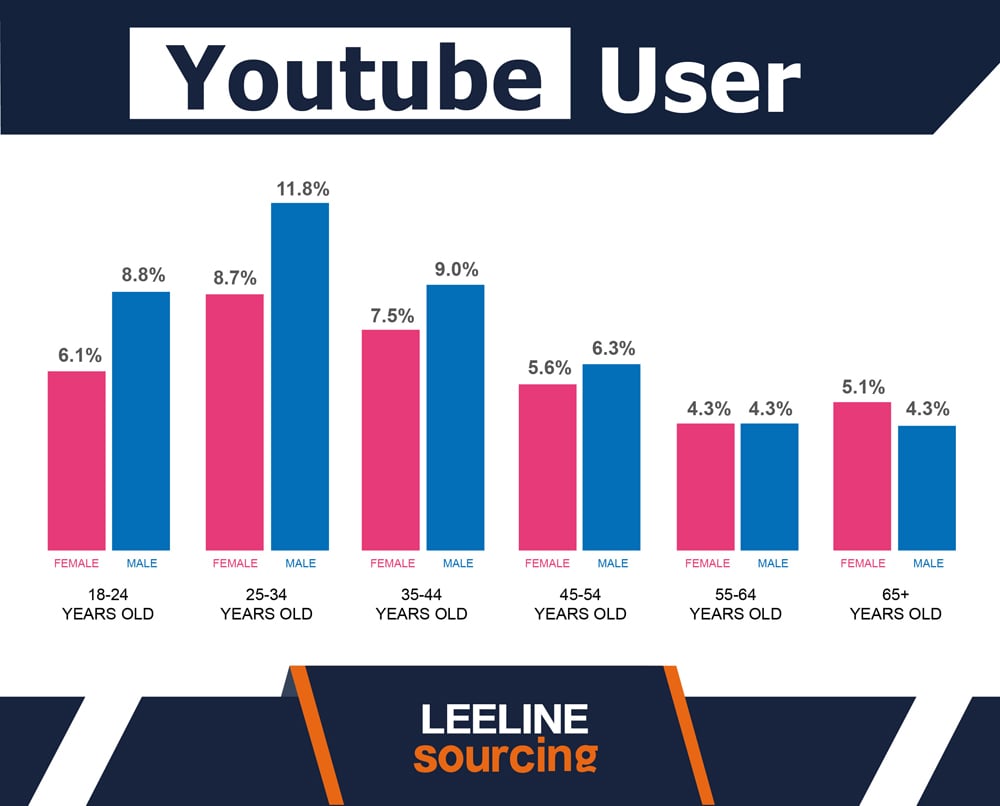
- In the 18-24 age group, the percentage of Youtube users is 6.1% females and 8.8% males.
- In the 25-34 age group, the percentage of Youtube users is 8.7% females and 11.8% males.
- In the 35-44 age group, the percentage of Youtube users is 7.5% females and 9% males.
- In the 45-54 age group, the percentage of Youtube users is 5.6% females and 6.3% males.
- In the 55-64 age group, the percentage of Youtube users is 4.3% females and 4.3% males.
- In the 65+ age group, the percentage of Youtube users is 5.1% females and 4.3% males.
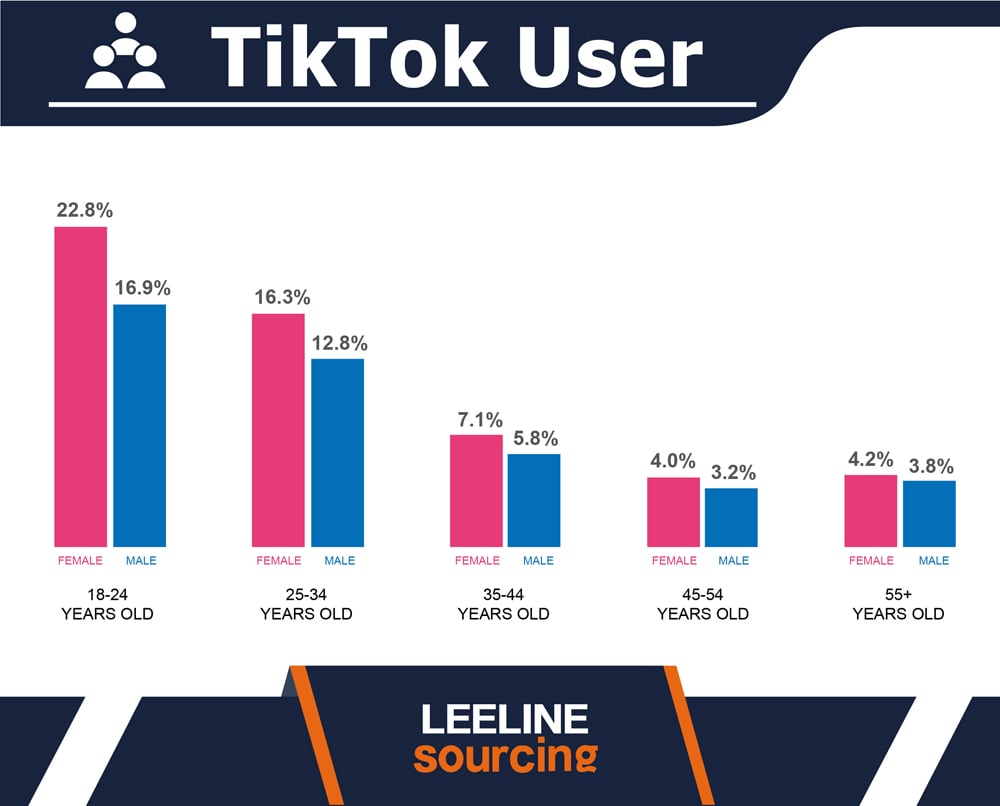
TikTok statistics
- In the 18-24 age group, the percentage of TikTok users is 22.8% females and 16.9% males.
- In the 25-34 age group, the percentage of TikTok users is 16.3% females and 12.8% males.
- In the 35-44 age group, the percentage of TikTok users is 7.1% females and 5.8% males.
- In the 45-54 age group, the percentage of TikTok users is 4% females and 3.2% males.
- In the 55+ age group, the percentage of TikTok users is 4.2% females and 3.8% males
Social media growth statistics
The latest social media statistics indicate how long a jump social media has in terms of GROWTH.
There is an AVERAGE yearly growth of 10% or more. It covers almost half of the WORLD’S POPULATION.
Isn’t it surprising?
Every internet user uses social media AT LEAST one time.
Here are the detailed social media statistics indicating the GROWTH.
- There were 4.2 billion users of SOCIAL MEDIA in 2021. These include Twitter users, Facebook users, and any other platform users.
- In January 2022, the growth rate was 10.1% leading to 4.6 billion users. In January 2023, it reached 4.76 billion users worldwide. Now the growth rate is 3%.
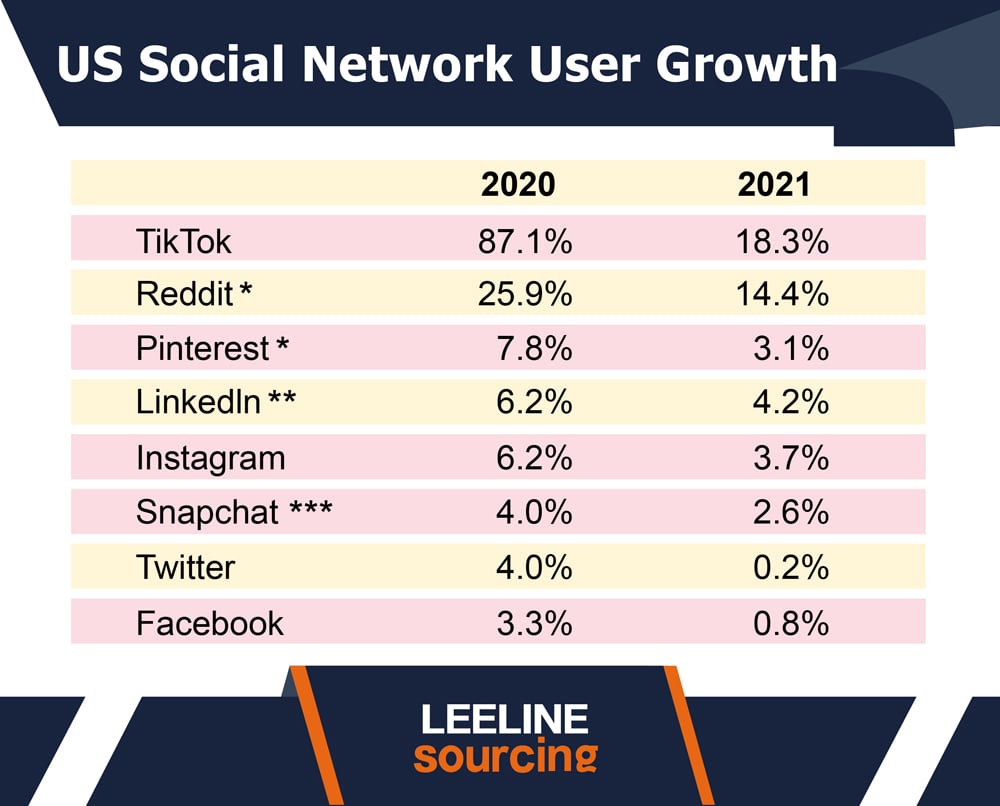
- TikTok’s highest growth jump was in 2020-21, with over 100% user growth. Currently, it has over 1 billion users all across the GLOBE.
- Reddit is second in terms of growth. It grew 26% in 2020 and 14.4% in 2021. Over the years, analysts reckon its upward growth graph.
- From 1930 to 2023, social media had an EXPONENTIAL growth. (A report from Our World in Data)
The detailed statistics are in the picture, which you can see.
When you check the statistics about SOCIAL media, you might not know the whole story.
Most users INCLUDE their favorite social sites. One question,
What is your Favorite social site? For me, it is Whatsapp. Tell yours below in the COMMENTS.
Look. When checking our FAVORITE social sites, the first thing is to note their POPULARITY.
Let’s check who is more popular.
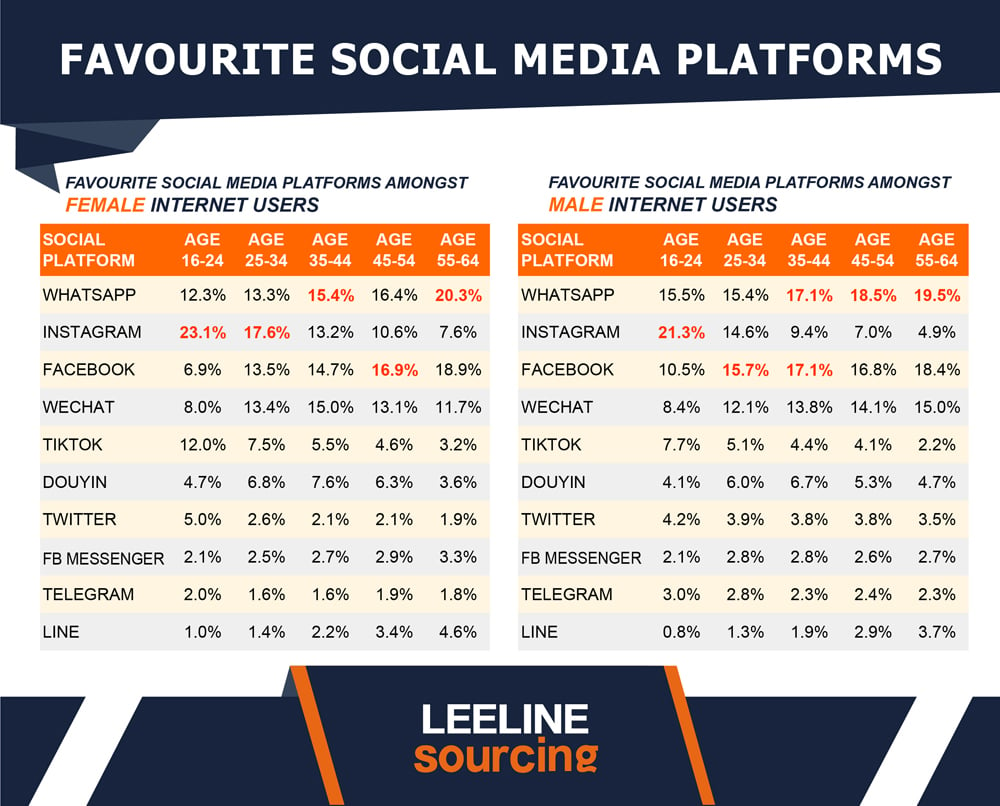
Among Males
- Among males, the most popular site is WhatsApp.
- In the age group 16-24, the users’ favorite site is Instagram. The percentage is 21.3%.
- In the age group of 25-34 years, the favorite is Facebook, with 15.7%.
- In the age group 35-44, two are the Favorites. Facebook and WhatsApp have 17.1% favoritism.
- In the age group 45-54, Whatsapp is the FAVORITE. The percentage is 18.5%.
- Aged 55-64 belong to Whatsapp with 19.5% favorite status.
Among Females
- Among females, the most popular site is Instagram.
- In the age group 16-24, the users’ favorite site is Instagram. The percentage is 23.1%.
- In the age group of 25-34 years, the favorite is Facebook, with 17.6%.
- In the age group 35-44, two are the Favorites. Facebook and WhatsApp have 15.4% favoritism.
- In the age group 45-54, Facebook is the FAVORITE. The percentage is 16.9%.
- Aged 55-64 belong to Whatsapp with 20.3% favorite status.
Social media mobile user statistics
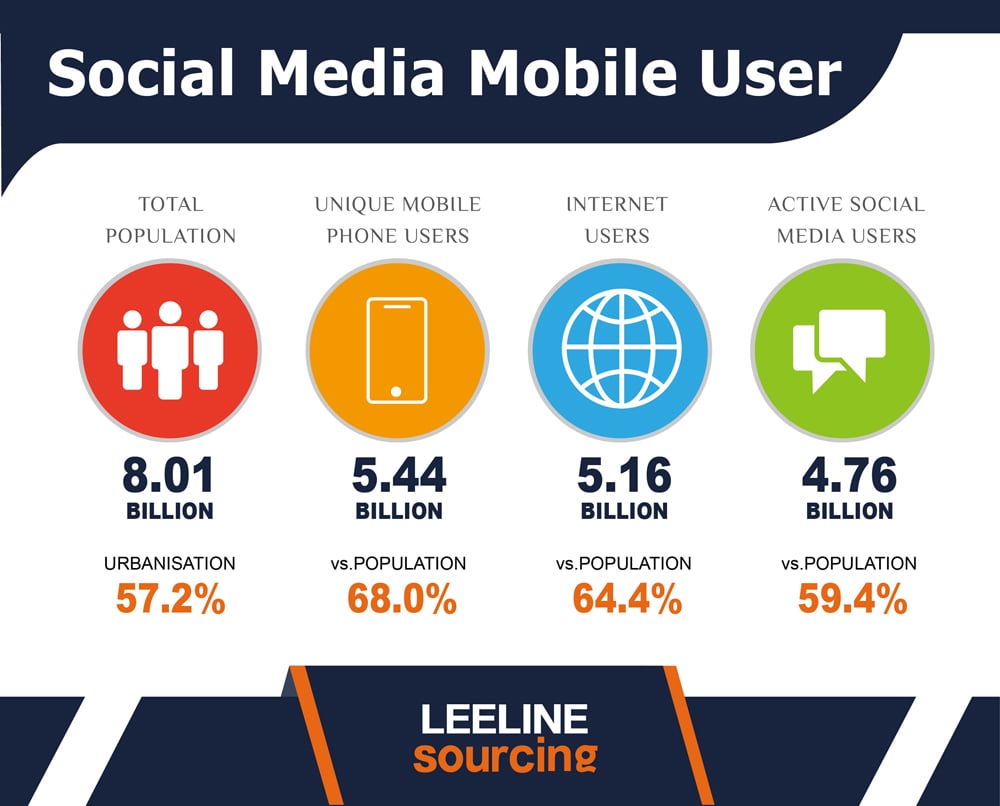
The eligible global population is 8 billion. Guess how many people would be USING mobile devices?
5.44 billion people are mobile users. A mobile user has different apps installed.
A social media app can then compel users to check SOCIAL media.
- 4.76 billion users access social media through Mobile or Desktop. These are Monthly active user figures. It constitutes around 59% of the TOTAL population.
- 91% of the TOTAL users are smartphone users. They open social media apps through mobile devices. It comprises around 4.33 billion users on smartphones.
Social media engagement statistics
The average engagement rate determines the EFFECTIVENESS of any platform. I remember when Facebook announced Care Emoji.
It increased the AVERAGE ENGAGEMENT rate of Facebook.
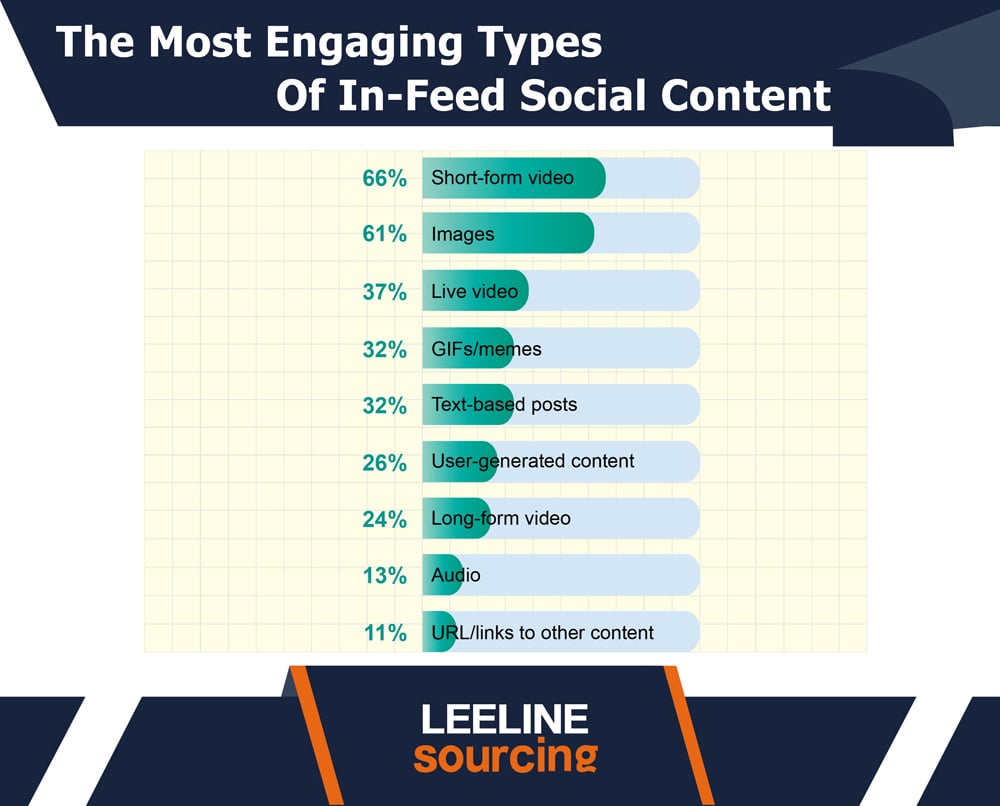
Videos, shorts, and music everything works as an ENGAGING tool. Here are the statistics for different mediums with different engagement rates.
- 66% of the users prefer to watch the SHORT forms rather than the long form in 2022. Short videos are 2.5X MORE ENGAGING.
- Images are the SECOND most engaging tool on social media. 61% of users have found the images as a fascinating tool.
- Live streams on Instagram and Facebook drive HIGHER traffic. 37% of users agree with that case.
- 26% of marketers say stories are the MOST VALUABLE type of social content.
- 93% of the companies have ACHIEVED their new customers through social media videos. It can be TikTok or Youtube, which generates videos with multiple features.
- 58% of the users watch the COMPLETE VIDEO if it is less than 60 seconds.
Social media marketing statistics
Are you planning a social media MARKETING STRATEGY?
Wait. No HURRY.
The primary question is, whether SOCIAL media will prove beneficial or not. Digital MARKETING is undoubtedly ahead of its time in driving the BEST results.
But there are some important social media statistics you must know.
79% of consumers purchased products from Social Media
A report from SproutSocial indicates the total percentage of consumers.
According to SURVEY, 79% of consumers agree about the social media impact.
“Social media marketing affects their PRODUCT purchasing decision.”
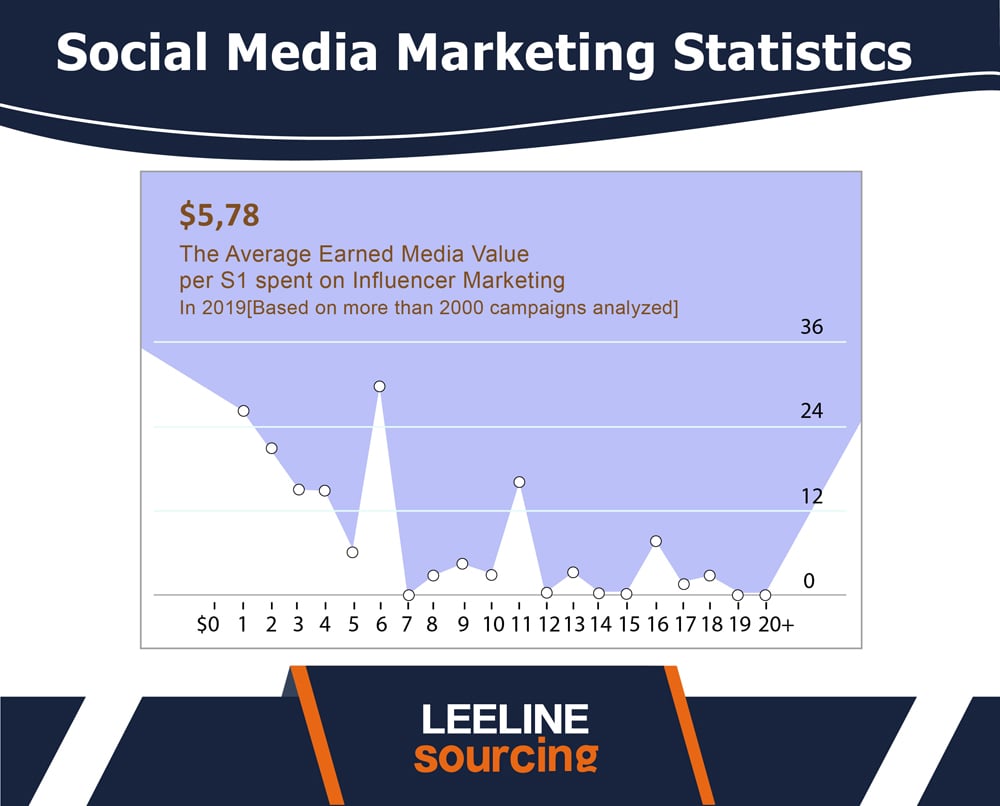
The average ROI per dollar is 5.78 dollars
According to the Influencer marketing Hub,
The average ROI per dollar spent is 5.78 dollars. Over the years, revenue has been different among the different platforms.
It can be a KEY to taking a start in SOCIAL MEDIA for your brand marketing.
Marketers devise marketing strategies for BRAND awareness.
As per an estimate, around 52% of marketers target users to get TRAFFIC. 40% of marketers drive sales through their SOCIAL MEDIA ACCOUNTS.
Social media is a PERFECT tool for brand awareness if you have a STARTUP.
57% of consumers follow their FAVORITE brands
People love to get MARKETING EMAILS from their favorite brands. They subscribe to the emails. And follow the brand on SOCIAL media.
57% of users have AGREED to these statements. (A report from Sprout Social)
49% of users unfollow a brand for poor CS
If the customer service is BAD, people do not like to FOLLOW the brands. They might even unfollow the BRAND for any incident related to poor customer service.
49% of social media platform users gave VALUABLE insights of the CUSTOMER SERVICE. ( A report from Sprout Social)
Social media advertising statistics
Social media advertising is one of the MOST POPULAR WAYS.
Users, Marketers, and advertisers spend billions of dollars reaching the Target audience. Even the estimates show an EXPONENTIAL increase in social media advertising.
Here is the LATEST social media data about the monthly advertising audience.
Social Media Ad spending has reached US$268.70bn in 2023
Social media ads have REACHED a new level of business.
Around 268.70 billion dollars are to be SPENT in 2023. The growth rate is 18.9% only in 2023. If such progress is going on, you can expect a manifold increase in ad spend.
The annual Growth Rate of Social Media is 9.40%
A report from Statista tells us ALL ABOUT the growth rate of social media advertising.
According to it, the average annual GROWTH in ads is 9.40%. Suppose such an increase continues over the years. In that case, the advertising campaigns will reach 384 billion dollars by 2027.
It is around 40% progress in the FOUR YEARS of 2023-2027. So social media can be a HELPFUL tool to target audiences.
77% of Marketers spend on Retargeting Ad
Retargeting ads are TARGET ads that reach customers. The customer clicks on them and opens them. Unfortunately, they did not make any PURCHASE.
Retargeting helps achieve High conversion and results.
Per Sprout Social Report, 77% of B2B and B2C marketers used retargeted ads to target audience.
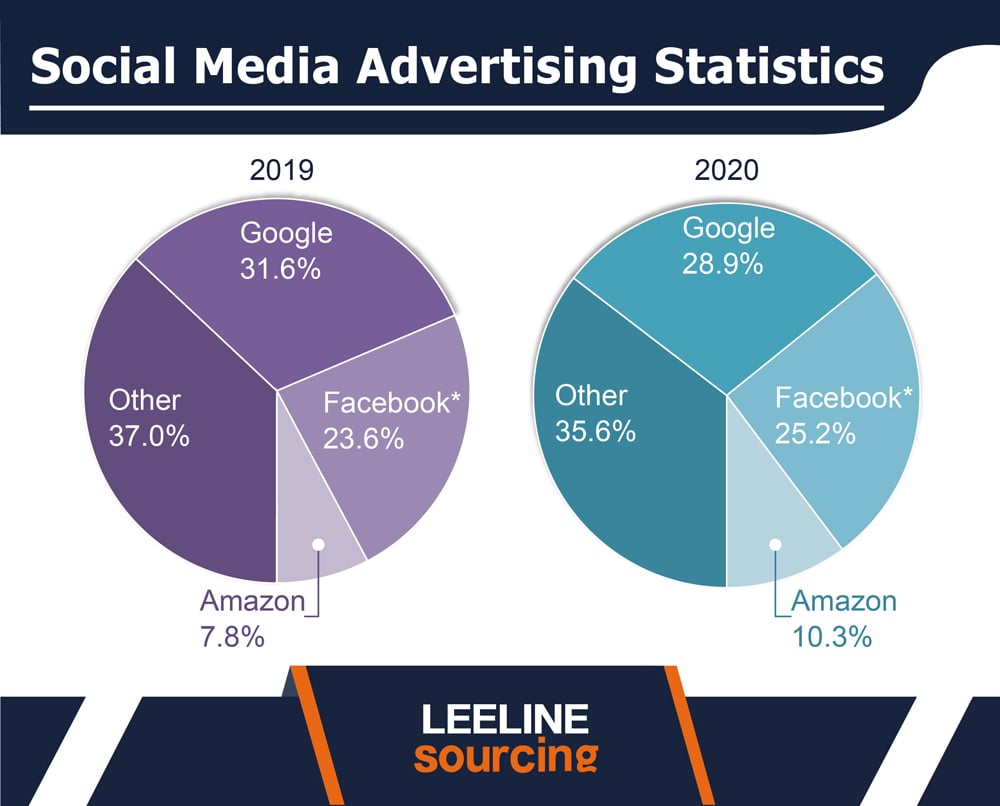
Different Advertising Spending in 2019 and 2020 on Google, Facebook, and other platforms.
- In 2019, ads spent on Google were 31.6%. Facebook preceded it with 23.6%, and Amazon PPC and other ads secured a THIRD SPOT with 7.8%. Other social media sites share 37% of ad revenue.
- In 2020, Facebook Statistics for advertising increased by 1.6%. At the same time, Google recorded a decrease of 2.7%.
It indicates how SOCIAL MEDIA advertising is dominating.
Social media business statistics
Have your CREATED Instagram business accounts?
Not only INSTAGRAM users but also Pinterest users love to see the BRANDS.
What does that prove?
It shows how big social media is for business owners. Maybe you are wondering about the latest SOCIAL MEDIA statistics.
Am I right?
Your quest ends here. Get them here.
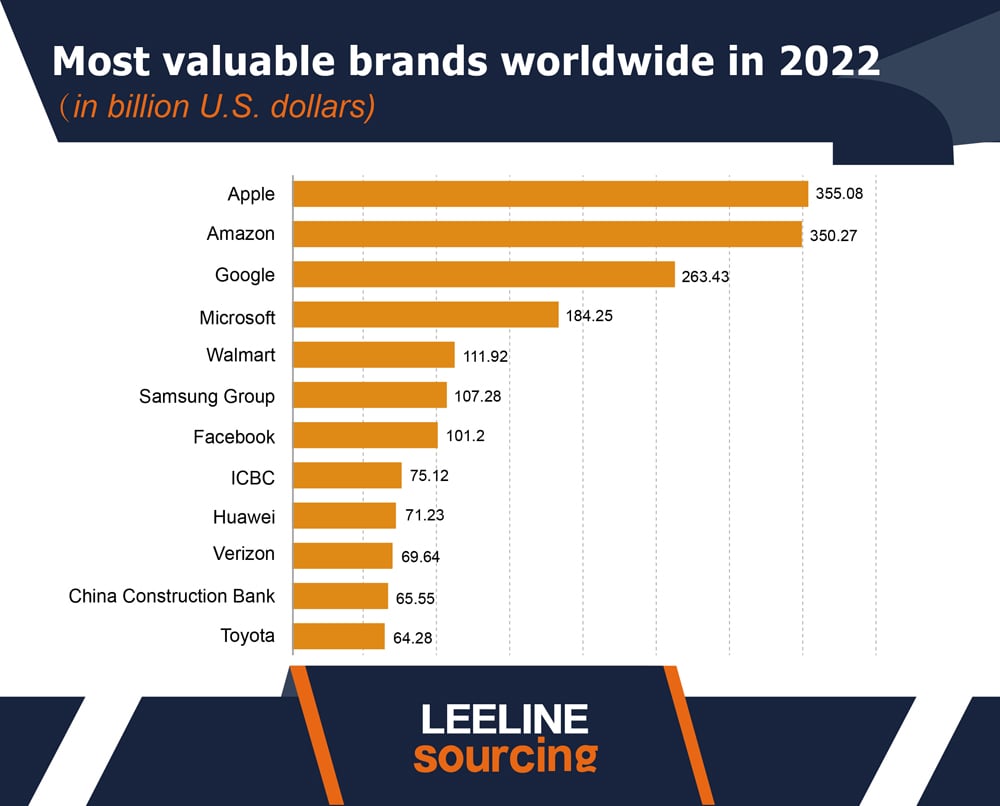
Facebook is Seventh Most Valuable Brand Worldwide
When it comes to BRAND VALUE, Facebook is a MARKET leader.
- Apple is on the TOP with a 355 billion USD market value. Facebook is on the SEVENTH number with a 101 billion USD brand value.
- In social MEDIA sites, Facebook is on the NUMBER 1. TikTok has been the EMERGING PLAYER of 2023 for Brand Value.
90% of Social media users use it for communication with Brands
Social media has the ULTIMATE purpose of connecting people. Sometimes, it allows the brands to link with the consumers.
In that case, 90% of active users use social media only to connect with BRANDS. It includes getting product updates or customer service.
70% of consumers get Customer SERVICE through Social Sites
Do you know the BIGGEST use of social media?
It is customer service. Multiple BRANDS allow the users to drop their concerns in the Inbox.
Around 70% of users have AGREED that they get customer service.
90% of Instagram Users follow at least one Brand
If you use Instagram, maybe you have followed BRANDS.
90% of Instagram users have followed their brands. They get both customer service and DISCOUNTS for the new products.
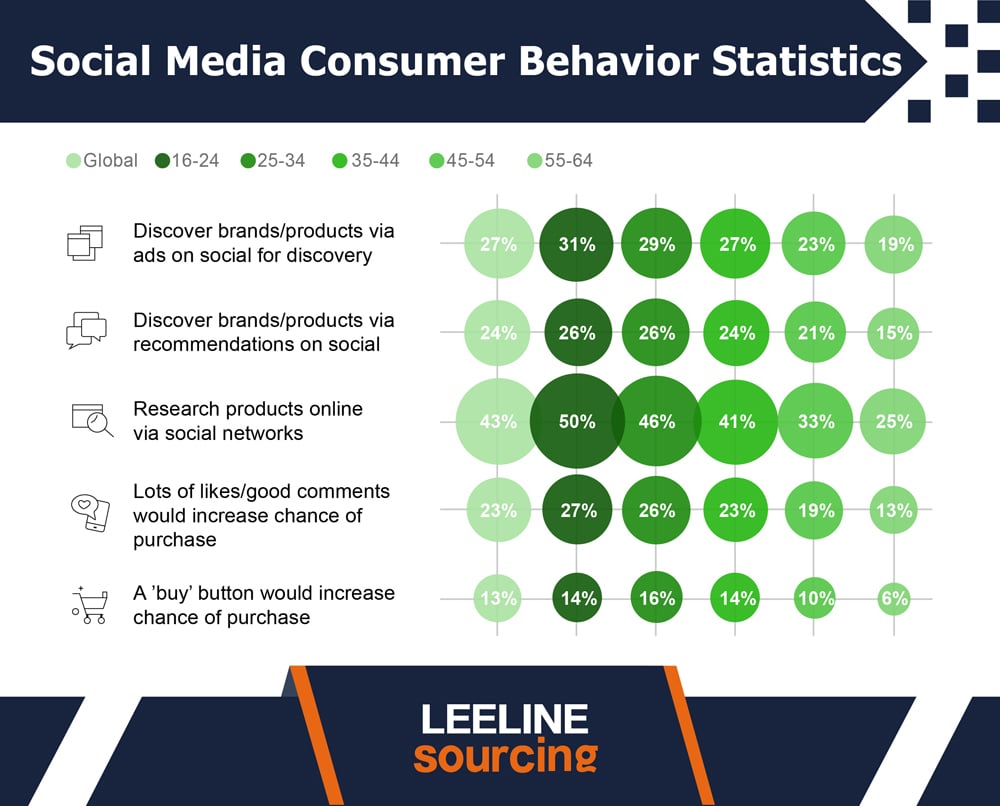
Social media consumer behavior statistics
A typical social media user does not make a PURCHASE decision alone.
When you open any PRODUCT online, social sites drive average user intention. That’s why the ads being shown on social media are RELEVANT to our product research.
Social media show not only RELEVANT ads but also influencer marketing effects. The INFLUENCERS recommend some products. And what happens?
The sale next time.
Let’s know how social media affects the purchase decision.
- 27% of the TOTAL POPULATION discover brands on social media through ads. The age group 16-24 years has 31% exposure.
- 24% of the users discover BRANDS via recommendations.
- 43% of consumers research products online via SOCIAL NETWORKS.
- 23% believe likes and comments increase the purchase.
- 13% choose the BUY button for elevated purchases.
- 50% of the 16-24 age group research products via SOCIAL SITES.
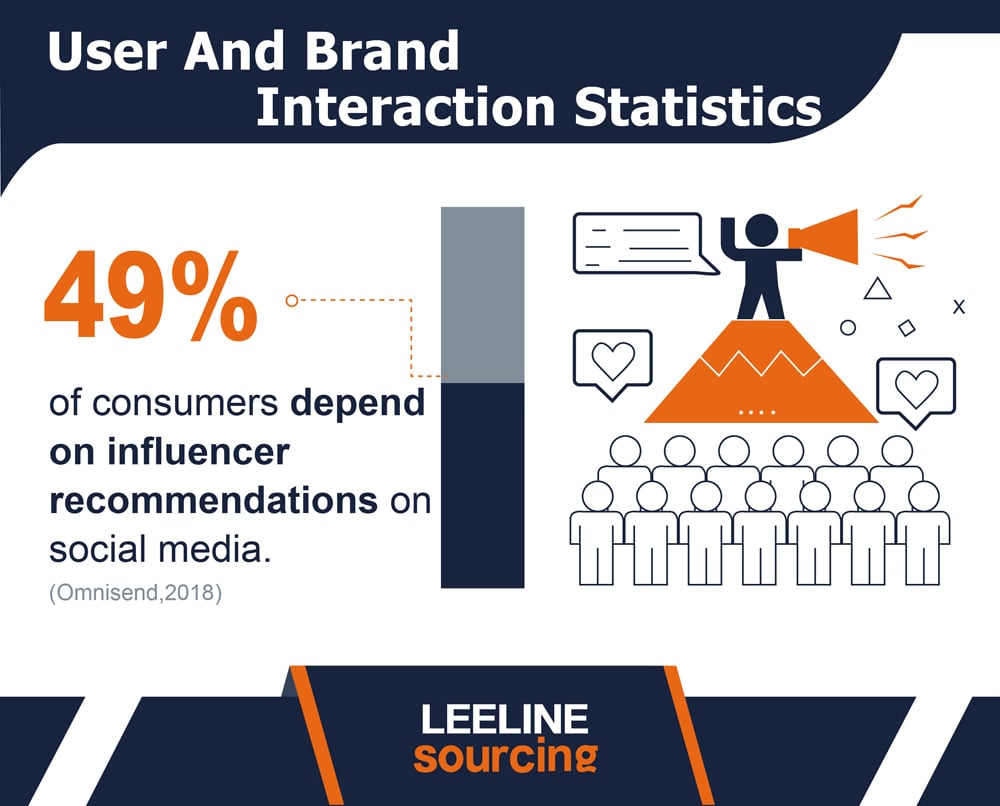
User and brand interaction statistics
An average social media user believes in what?
Is whom he follows right?
That is where the INFLUENCERS are BIG PLAYERS in the social market. The users follow them. Know what they LIKE. Watch their videos. And follow them on all of the social sites.
Brands have TARGETED the customers through the INFLUENCERS. Marketing responses were better with fewer investments.
Here are the details of the impact of User and Brand Interaction.
- 49% of the USERS make product purchases after the INFLUENCERS’ recommendations.
- 69% of the BRANDS use social media to approach the users. Know what they need. And improve their brand awareness by fulfilling their demands.
- 40% of the BRANDS drive their sales through social media sites.
- More than 70% of brands use SOCIAL MEDIA ads to reach customers. And get sales.
- Almost 70% of users get their CUSTOMER SUPPORT from brands through social media.
- In the HubSpot Blog Poll, 79% of marketers choose Facebook Advertisements.
What’s Next
We all know how much MARKETING AND ADVERTISING have risen on social media.
If you are a BUSINESS owner, Facebook business or content marketing is WHAT:
- Speed up your progress up to 100% or more in one YEAR!
- Get proven RESULTS with detailed INSIGHTS.
- Transparent and smooth sales with 5X ROI.
Want more statistics like that?
Visit our website and get the LATEST statistics about different social tools.